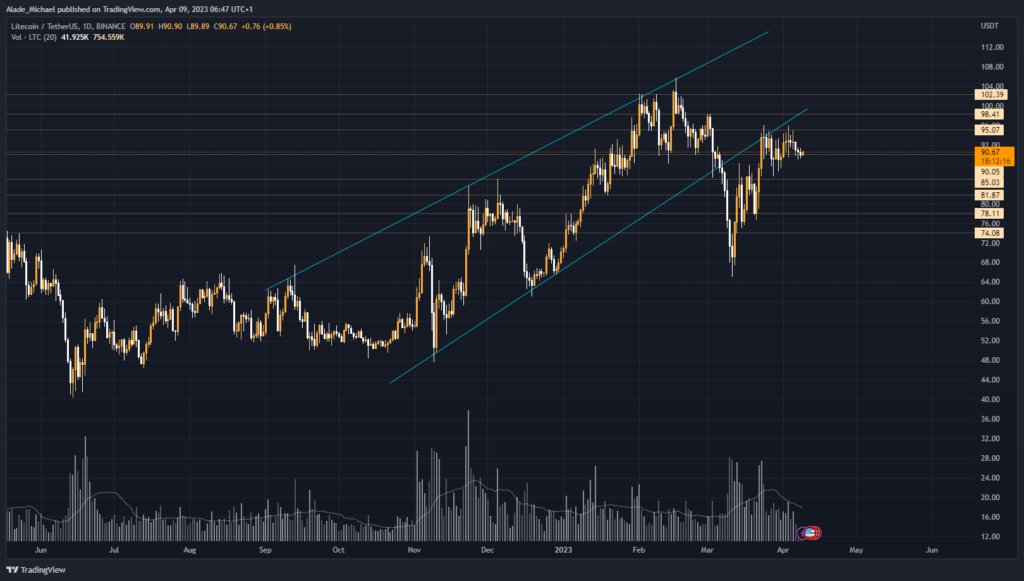
As Bitcoin remained indecisive for weeks, Litecoin suspended its bullish rally to a consolidation move due to low volatility. The price has been on the low since the start of this week, with a 2.3% loss.
Following last month’s breakdown to the $65 level, Litecoin pinned support at that level and recovered steadily for two weeks.
This recovery led to a retest of the crucial $95 level as resistance. The price dropped to $86 and recovered again. Unfortunately, it failed to sustain momentum above the crucial resistance due to multiple rejections.
While the price enters a consolidation phase, LTC appears to be forming a bearish pattern on the daily chart below. However, the last month’s breakdown level of $90 has been serving as holding support for the past few days.
A successful crack at this holding support level could lead to a huge sell-off in the future. Another thing to consider for a potential bearish is a continuous decline in the daily volume indicator since the price retested the wedge’s lower boundary as resistance.
On the other hand, if the coin regains momentum and manages to surpass the crucial resistance, we can expect it to advance higher. For now, February’s high remains a vital breakpoint for a mid-term rally.
Litecoin’s Key Price Level To Watch

Litecoin’s chances of losing momentum are higher than gaining momentum at the moment. For a breakdown, the potential support level to watch for a rebound is $85, followed by $81.8 and $78.1. There’s also support at $74 in case of a heavy drop.
An increase above the crucial $95 level should propel buying to the $98.4 and $102.4 resistance levels. The $105.7 resistance level marks a vital breakpoint for a big rally.
Key Resistance Levels: $95, $98.4, $102.4
Key Support Levels: $85, $81.8, $78.1
- Spot Price: $90.7
- Trend: Bullish
- Volatility: Low
Disclosure: This is not trading or investment advice. Always do your research before buying any cryptocurrency or investing in any projects.
Image Source: bizoon/123RF // Image Effects by Colorcinch


