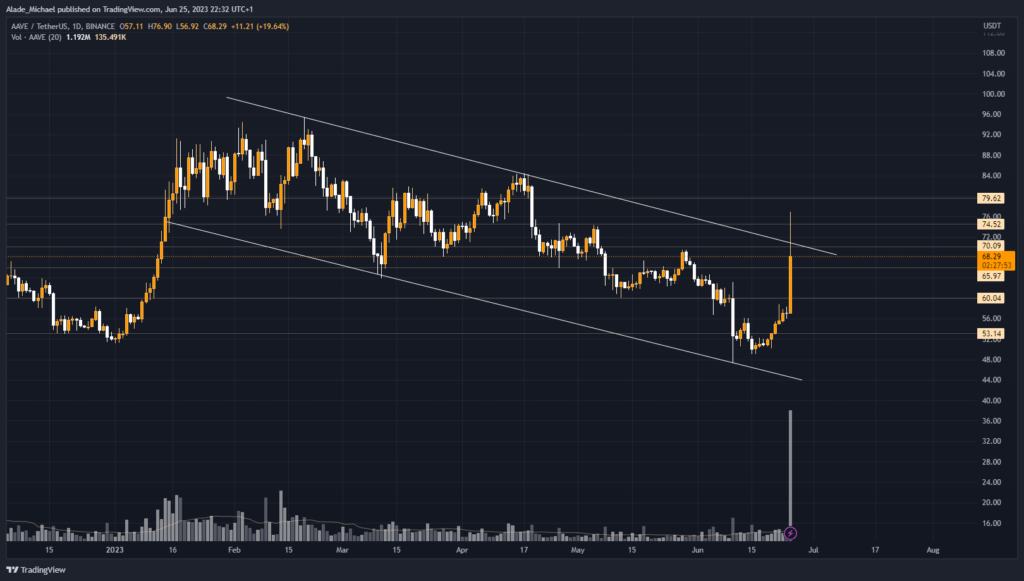
Aave recovered slowly from a four-month low and rallied hard with over 30% weekly gain. This substantial gain saw the price above its mid-term descending channel but later fell back after it encountered resistance.
Following a bearish impulsive movement from $96, Aave pinned support at $47.3 earlier this month and started to recover by the day.
Trading volatility became high this week and the price surged massively to the peak of $77 today. The peak price level was sharply rejected and the price dropped to around $68 at the time of writing.
Although, the rejection led to a false breakout after surging through a descending channel that captured bearish movement for six months. Aave appears to be looking for solid ground on the lower timeframe to provide a rebound. The closest support for such a setup is $66.
A notable daily close above this channel will mark the most volatile week for the bulls since January. That alone could trigger more positive sentiment in the coming week. And if the price continues to drop, it may look for lower levels.
Despite the price rejection, Aave currently remains the top-gainer of the market with a 21% gain in the past 24 hours. The trend looks bullish and seems to have reversed on the hourly chart, but still looking for a breakout on the daily.
Aave’s Key Levels To Watch

The price is trading price near the $66 support level, a drop below it could later slip the price to $60. The lower level for more drops lies at $53.1.
If the price advances bullish, the $70 level must be reclaimed before breaking above the channel to $74.5 and $79.6. The crucial resistance to watch lies at $84.5.
Key Resistance Levels: $70, $74.5, $79.6
Key Support Levels: $66, $60, $53.1
- Spot Price: $68.3
- Trend: Bullish
- Volatility: High
Disclosure: This is not trading or investment advice. Always do your research before buying any cryptocurrency or investing in any projects.
Image Source: ivanbabydov/123RF // Image Effects by Colorcinch


