BNB broke through the long-term descending resistance line but remained below the horizontal resistance area. BNB also broke out of the short-term pattern and attempted to rise above the short-term resistance line.
BNB is Approaching Resistance
Since November 2021, the price of BNB has been declining along a long-term descending resistance line and reached a low of $183 the following June. Since then the price has increased.
After a failed bullish breakout attempt, the token finally rose above the 770-day resistance line in December 2023. This allowed the price to record a high of $338, just below the horizontal resistance area. BNB continued to rise, but has not yet been able to make a bullish breakout.
The BNB Ecosystem Continues to Grow
Today the BNB team published statistics on the project’s ecosystem. As you can see, the daily transaction rate was 3.74 million with an average gas fee (only 0.00044 BNB).
In addition, the team announced the BNB Chain Hackathon 2024. Applications for participation in it are accepted until February 1, and the prize fund will be more than $1 million.
Announcing BNB Chain Hackathon 2024! 🏆
With an annual prize pool of over $1M+, each quarter introduces a hackathon focused on a different theme!
Ready to dive in? Here’s how to participate! 🧵[1/8]
Apply today: https://t.co/9xlVLC2BJHhttps://t.co/dckmZNzzST pic.twitter.com/UOC4ds8Igm
— BNB Chain (@BNBCHAIN) January 17, 2024
Finally, in the public session tomorrow, the team will talk about opBNB, a layer 2 scaling solution for BNB Smart Chain.
Will The Growth Continue?
The daily timeframe confirms the signals from the weekly chart. It shows that in December 2023, price made a bearish breakout from an ascending parallel channel. This is a sign that the upward movement is impulsive.
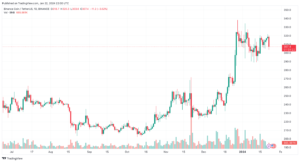
Although the token has been declining below a short-term descending resistance line for the past 25 days, it has made numerous attempts to break through it. As the trend lines weaken with each new touch, a breakout of this barrier is expected eventually.
Elliott wave analysis confirms this forecast. The most likely wave scenario suggests that the price is in the fourth wave of a five-wave bullish structure. The fourth wave took the form of a symmetrical triangle, which is the most likely technical pattern for such a correction.
Finally, the daily RSI is above the neutral level of 50 and rising, which is a bullish sign. If the token makes a bullish breakout, it could rise 14% to the next resistance at $360.
On the other hand, a price decline within the channel could result in a 13% drop to its midline at $280.
Mega BNB Burn Plans
On January 17, Binance cryptocurrency exchange held its 26th quarterly burning of BNB tokens. As a result, it withdrew 2,141,487 BNB from circulation for a total value of approximately $636 million at the time of writing. According to the reports, the burning procedure was carried out under the Pioneer Burn and Auto-Burn programs. Note that the company plans to burn 50% of the total supply of coins in order to reach a volume of 100 million BNB.

