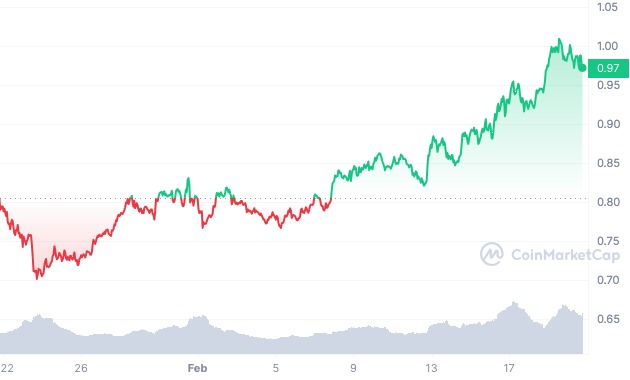
Polygon broke through the long-term descending resistance line drawn from the all-time high of December 2021. MATIC also reached the top of a long-term horizontal range. Let’s figure out what awaits the price – a bullish breakout or a rebound.
MATIC Broke Long-Term Resistance
The weekly timeframe shows that MATIC has been rising since June 2022. After forming an increasing low in October 2023, the token accelerated its growth rate.
Last week, the price broke through a descending resistance line that was almost 800 days old and was built from the December 2021 all-time high. MATIC has previously made several unsuccessful attempts to break through it.
The weekly relative strength index (RSI) is giving a bullish signal. The indicator bounced off the neutral 50 level during the bullish price breakout, thereby reinforcing the breakout.
Cryptocurrency traders and analysts on Platform X are bullish on Polygon’s prospects. Thus, CryptoBusy identifies the “cup and handle” technical pattern and believes that the price will rise to $3.
$MATIC less than $1 is a huge discount!
Have you seen this huge Adam and Eve bullish pattern?
See you at the top then!📈#Polygon pic.twitter.com/JMRGp5MPZg
— CryptoBusy (@CryptoBusy) February 19, 2024
NFT Cryptomaniac has the same opinion, he said: “There is nothing new here! I will let you know if anything changes, otherwise just close your eyes and you will open them at $1.80-$1.90-$2.00 levels depending on FOMO.”
Polygon Price Prediction: Can MATIC Reach $2?
The 3-day time frame also gives a bullish outlook, supporting the weekly chart. Price action shows MATIC approaching the top of its long-term range at $1. This range has been present on the chart since July 2022.

Elliott wave analysis also suggests that a bullish breakout will occur. According to the most likely scenario, the token is in the third wave of a five-wave upward movement.
Finally, the 3-day RSI also supports a breakout, having recently moved above 30.
The ratio of the first and third waves as 1:1 gives us a maximum of $1.55, which is 55% higher than the current price. If the third wave extends to a ratio of 1.61 to the length of the first wave, it could reach $2.05, which is 110% higher than the current price.
Despite this bullish outlook, a price bounce from the range high could trigger a 30% drop towards the mid-range at $0.70.


