Shiba Inu (SHIB) broke the upper boundary of the symmetrical triangle amid growing buying pressure. However, the price of the popular memecoin Shiba Inu is trading above the upper boundary of the symmetrical triangle, which has served as resistance since March 7th.
Shiba Inu enjoys bullish sentiment
Market conditions are favorable for Shiba Inu (SHIB). Several factors point to a possible continuation of the bullish trend. Meanwhile, a breakout of the upper boundary of the symmetrical triangle is considered a bullish signal. It is strengthened by the positive dynamics of open interest (OI).
Currently, open interest in SHIB futures stands at $77.26 million. The figure is up 38% since the beginning of the month and is at its highest level since April 14, indicating an influx of new capital into the asset and an increase in the number of traders opening new positions.

The positive financing rate also confirms optimism. This mechanism provides a balance between long and short positions in the perpetual futures market.

Positive values indicate dominance of long contracts and mean that the contract price is above the spot price. This means that more traders are buying the coin with the expectation of selling at a higher price.
SHIB Price Forecast: A Pullback May Happen First
The token is trading above the long-term resistance level, but the risk of correction will remain. Key technical indicators warn of this.
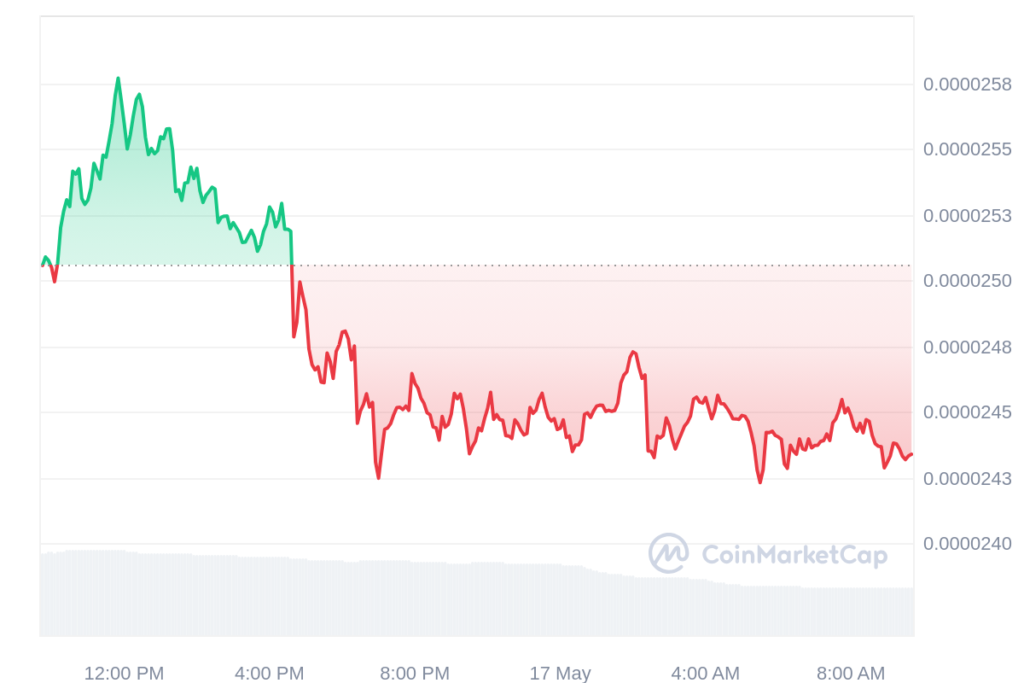
For example, the MACD indicator gives alarming signals. However, this metric demonstrates the relationship between two moving averages of an asset’s price. The index consists of two lines – the MACD line and the signal line. When the short-term moving average moves below the long-term moving average, it is considered a bearish sell signal. This is exactly the picture now observed on the SHIB chart.
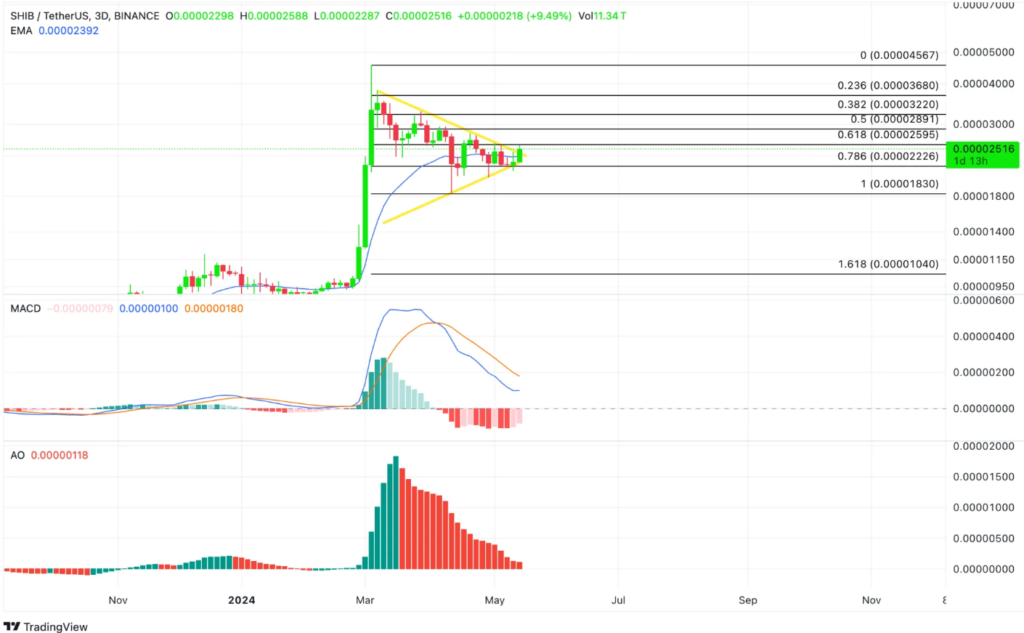
In addition, the Awesome oscillator generates red bars. Moreover, this color indicates bearish momentum, which is often considered a signal to start selling or going short.
If bearish activity intensifies, Shiba Inu may break through the lower border of the triangle, which served as support, and decline to $0.00002535. Meanwhile, further development of the movement in the upward trend may bring the price to the area of $0.000028.

