

Introduction
Bitcoin’s price has been moving downward, leaving traders uncertain about its next direction. Key support and resistance levels suggest that BTC could either continue its decline or regain strength for another rally. The cost basis distribution chart highlights two major price zones: a strong resistance at $97,828, where large amounts of BTC have been accumulated, and a critical support level at $64,078, where buyers have previously stepped in to prevent further losses. The next few weeks could determine whether Bitcoin breaks higher or faces further corrections.
Key Resistance and Support Levels for Bitcoin
BTC’s cost basis distribution shows that 360,470 BTC were accumulated around $97,828, making it a significant resistance point. Historically, when many investors hold BTC at a certain level, it becomes harder for the price to break through unless buying demand surges. Events such as ETF inflows or bullish market cycles could provide the needed catalyst to push BTC beyond this barrier.
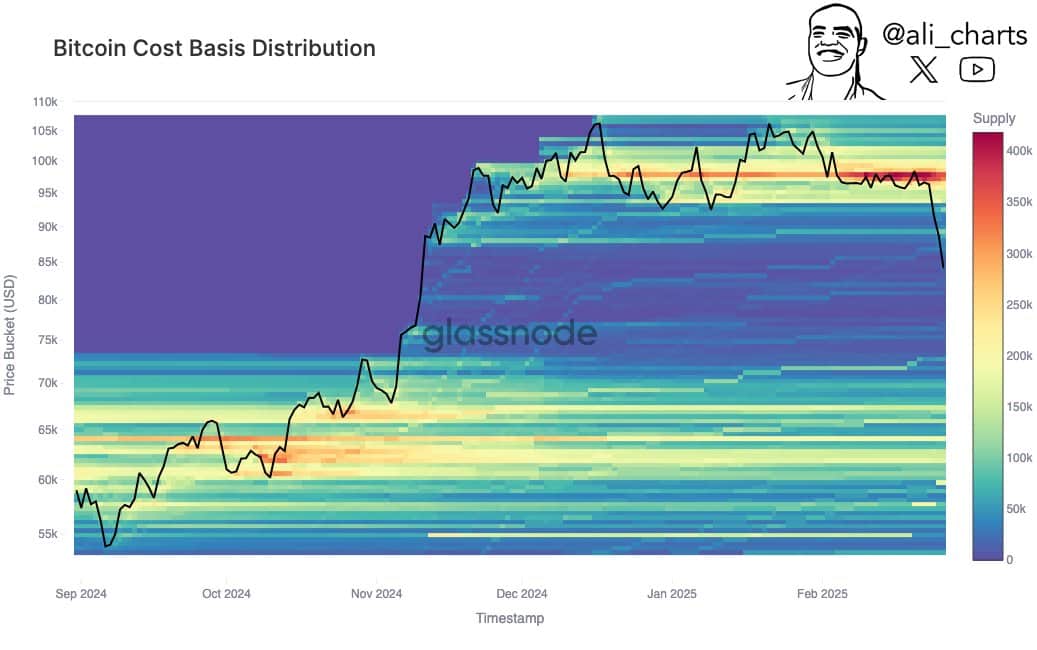
On the other hand, $64,078 has acted as a strong support level, with 194,530 BTC accumulated there. This suggests that buyers have stepped in at this range before, preventing BTC from dropping further. If BTC falls toward this level again, it could either bounce back or break lower, triggering even more losses.
Bitcoin Price Structure and Market Behavior
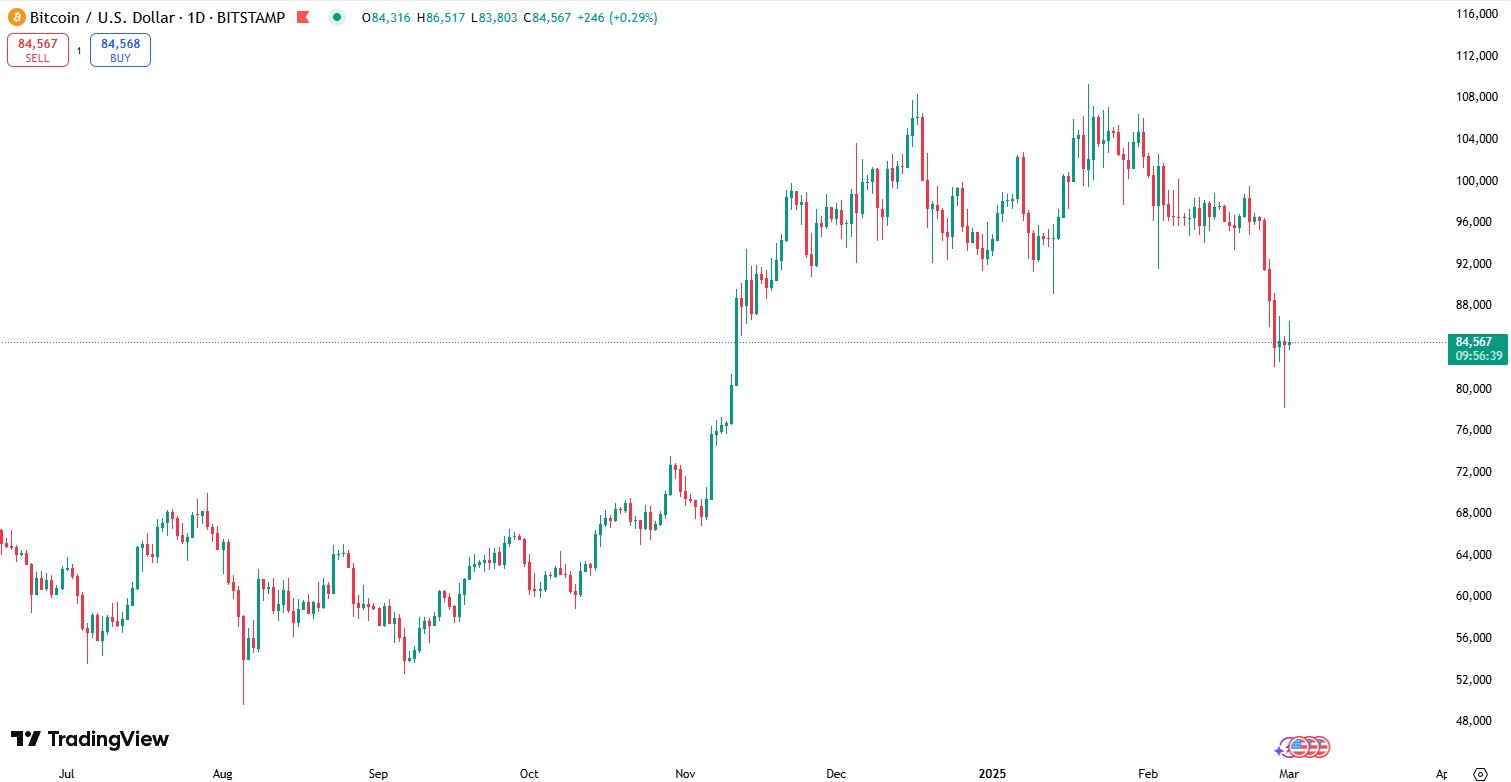
From September 2024 to early 2025, Bitcoin experienced a strong rally from $55,000 to over $108,000, showing solid momentum along the way. Many investors bought BTC between $60,000 and $75,000, creating a high-support zone. However, after reaching nearly $100,000, BTC retraced and is now hovering near the upper bands of its key support range.
If BTC fails to reclaim $97,000, the price could drop toward $75,000 before testing the $64,000 support zone. A break below $64K would signal a deeper correction, possibly pushing BTC back to $55,000. On the flip side, if BTC manages to break above $97K, it could trigger a renewed bullish uptrend, potentially surpassing its all-time high of $108,000.
Bitcoin Historical Patterns and Moving Averages
Bitcoin has a history of finding support at the 50-week moving average (MA), which currently sits at $74,700. Looking at past cycles, BTC has tested this level before continuing upward. In 2015, 2019, and 2021, BTC bounced off this moving average and went on to make significant price gains.
At the moment, BTC has retraced from $97K and is moving closer to the $74,700 support zone. If BTC stays above $85,000, it could see a rebound toward $90K before retesting the $97K resistance. However, if BTC loses its current support, the price could dip toward $64,000, a key accumulation zone for investors. A break below $64,000 would likely cause bearish sentiment to spread, increasing the chance of a larger market correction. On the other hand, if BTC successfully breaks and holds above $97K, the odds of reaching new all-time highs beyond $108K would increase significantly.
Conclusion
Bitcoin is at a crossroads, with key resistance at $97K and support at $64K shaping its next move. If BTC holds above the 50-week moving average and reclaims $97K, it could spark another rally toward new highs. However, if the price continues to drop and falls below $64K, a deeper correction could unfold. The next few weeks will be crucial in deciding whether BTC continues its bullish trend or enters a prolonged downturn.