

Ethereum [ETH] has been on a tear lately, clocking in a hefty 35% gain over the past month. The latest rally saw another 10% surge in just 24 hours. While some of this bullish energy comes from Bitcoin profits rotating into ETH, there’s a bigger, more fascinating narrative in play, a 28-day fractal that might just unlock Ethereum’s next big leg up.
According to Joao Wedson, market analyst and founder of Alphractal, Ethereum tends to explode roughly four weeks after Bitcoin prints a new all-time high. Historically, this pattern has played out like clockwork. Back in 2017 and 2021, Ethereum staged monster rallies of 80% to 100% while Bitcoin cooled off.
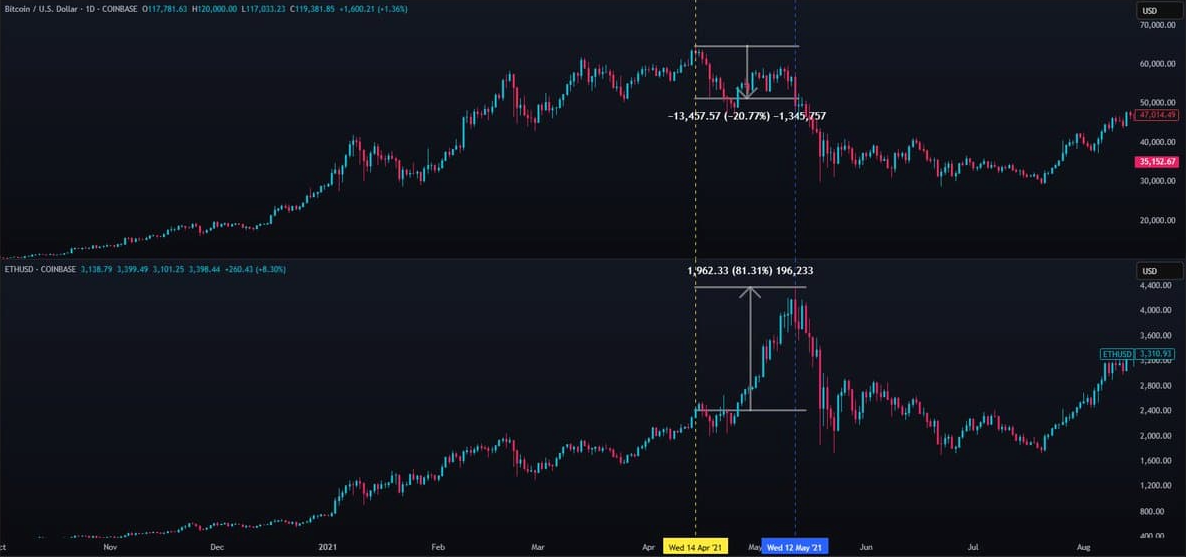
With Bitcoin hitting a fresh all-time high of $123,000 on July 14th, the countdown appears to be ticking. The next question is whether Ethereum’s historical rhythm will deliver again.
Momentum Is Building, Are Sellers About to Regret Their Bets?
Taking a closer look at the ETH/BTC chart, the signals are leaning bullish. ETH has been printing higher highs, a textbook sign of growing liquidity flowing into ETH and bleeding from BTC. Currently, Ethereum is approaching the resistance zone at 0.02938 BTC.
A rejection here might cause a pullback toward the $0.02605–$0.02540 range, but don’t celebrate just yet if you’re a bear.
The Aroon Indicator, which tracks the strength of a trend, is screaming bullishness. The Aroon Up (orange) hit a perfect 100%, while the Aroon Down (blue) languishes at a meager 7.18%. Translation? The bulls are running the show, and the sellers might be walking into a trap.
Spot Buying Heats Up with $11M Inflow
Fresh data from CoinGlass shows that spot investors have returned to the Ethereum market after a brief pause. Over the last 24 hours, spot exchange netflows jumped by $11 million. What’s even more telling is that much of this ETH is migrating into private wallets, a classic move from long-term holders positioning for future gains.
These inflows aren’t just numbers on a chart. They reflect rising conviction that ETH has more room to run, adding fuel to the bullish momentum.
Ethereum Technical Indicators Signal More Upside Ahead
Beyond spot buying and fractal theories, technical indicators are flashing green for ETH. The Moving Average Ribbon is showing a bullish setup, with the short-term 20 and 50-day moving averages crossing above the 100-day MA.
The final confirmation traders are waiting for? A clean crossover above the 200-day MA. If that happens, it could trigger significant pain for sellers still clinging to resistance zones.
Can Ethereum Finally Smash Through Resistance?
ETH currently trades near $2,950, eyeing the $3,030 resistance that has historically caused trouble. While the risk of a pullback lingers, the bullish narrative is well-supported. With fresh inflows, technical momentum, and historical patterns aligning, Ethereum’s path toward new highs might not just be hype, it could be history repeating itself.
If the bulls keep control, breaking past $3,030 might just open the door for Ethereum’s next big breakout.