Introduction
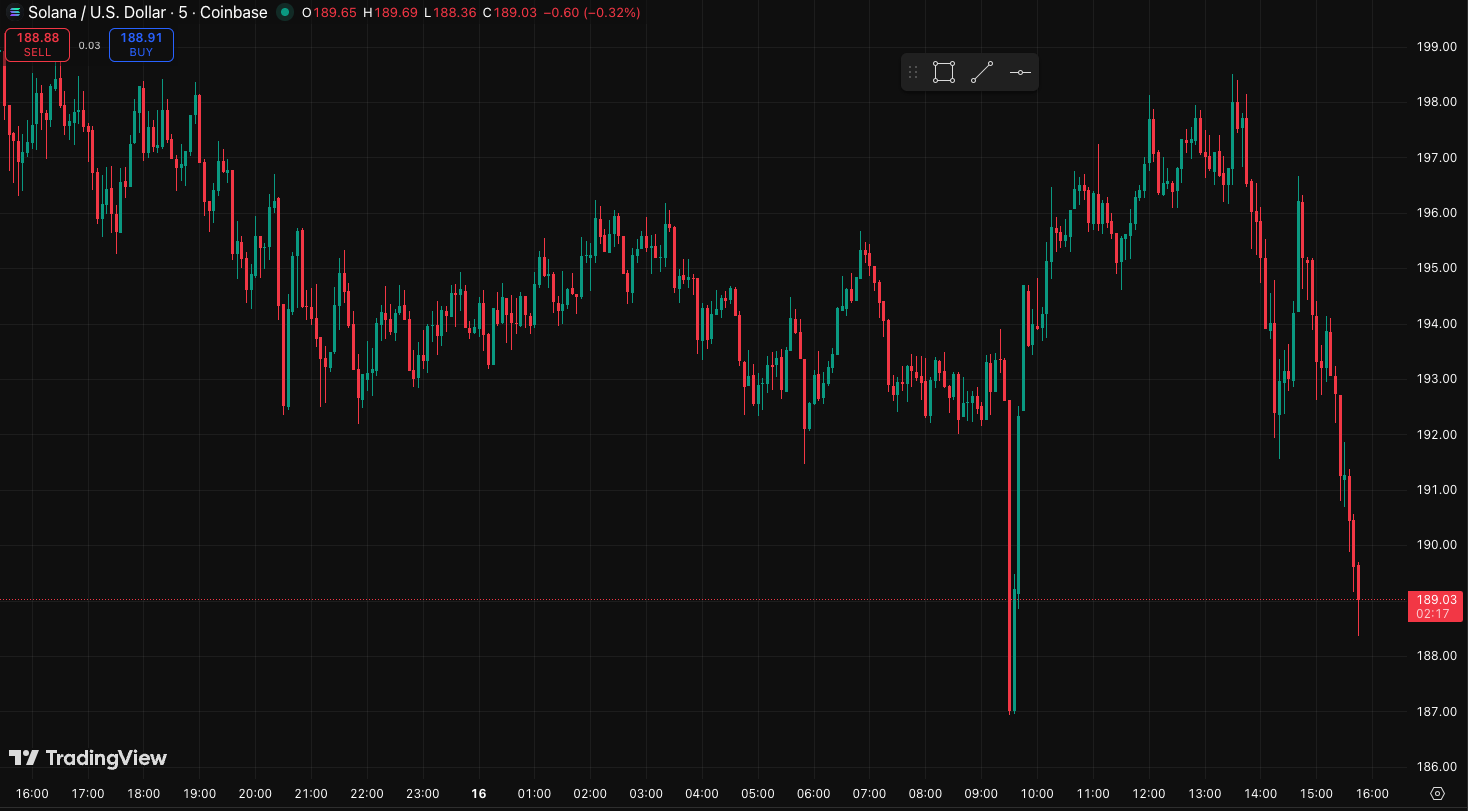
Solana has slipped beneath the $200 mark after a volatile week, with recent data suggesting the network may be forming a local market bottom. Despite ongoing selling pressure, on-chain indicators point to a potential stabilization between $180 and $190 , a zone that could set the stage for another upward move.
Decline and Market Behavior
Over the past seven days, Solana’s price fell 15%, largely due to a sharp decline on October 10 when it dropped from $220 to $168 before rebounding modestly. The asset is now testing the $200 resistance level, a price that has proven difficult to reclaim.

Recent on-chain data indicates that selling activity, which was strong through September, has begun to ease. The slowdown in profit-taking suggests that some traders are holding positions in anticipation of a rebound.
Solana Key Levels and On-Chain Signals
The cost-basis distribution heatmap highlights heavy activity around the $180–$190 region, where demand has historically returned following sell-offs. Similar price behavior was recorded in August and September, when Solana fell below major support levels before recovering and retesting those zones.
The Hodler Net Position Change metric remains negative but is trending toward zero, signaling that profit-taking is declining. This pattern, combined with reduced forced selling, often coincides with local market bottoms.
Solana Market Sentiment and Outlook
Spikes in the capitulation metric show increased selling at a loss , a signal typically associated with the end of downward phases. At the same time, supply data from the cost-basis distribution chart reveals reduced selling near the $230 range, hinting at market exhaustion.
If Bitcoin maintains strength above $117,000, Solana could see renewed momentum toward $220. However, a Bitcoin drop below $108,000 would likely pressure Solana further, putting its short-term recovery in question.


