Bitcoin has spent most of December trading within a narrow range, signaling a period of consolidation rather than directional momentum. After closing at $91,277 on December 2, BTC has continued to move sideways, reflecting a balance between buyers and sellers.
This range-bound behavior coincides with a noticeable return of accumulation. On-chain data suggests that long-term oriented investors are increasing exposure, raising questions about whether renewed demand could support a move toward higher price levels.
Accumulator Addresses Increase Holdings
Bitcoin accumulator addresses began increasing their exposure in early December. According to CryptoQuant data, these addresses collectively acquired approximately 78,000 BTC between December 1 and December 10.
During this period, balances held by accumulator addresses rose from roughly 237,000 BTC to 315,000 BTC. Based on prevailing prices, this represents about $7.2 billion in capital deployed in less than two weeks.
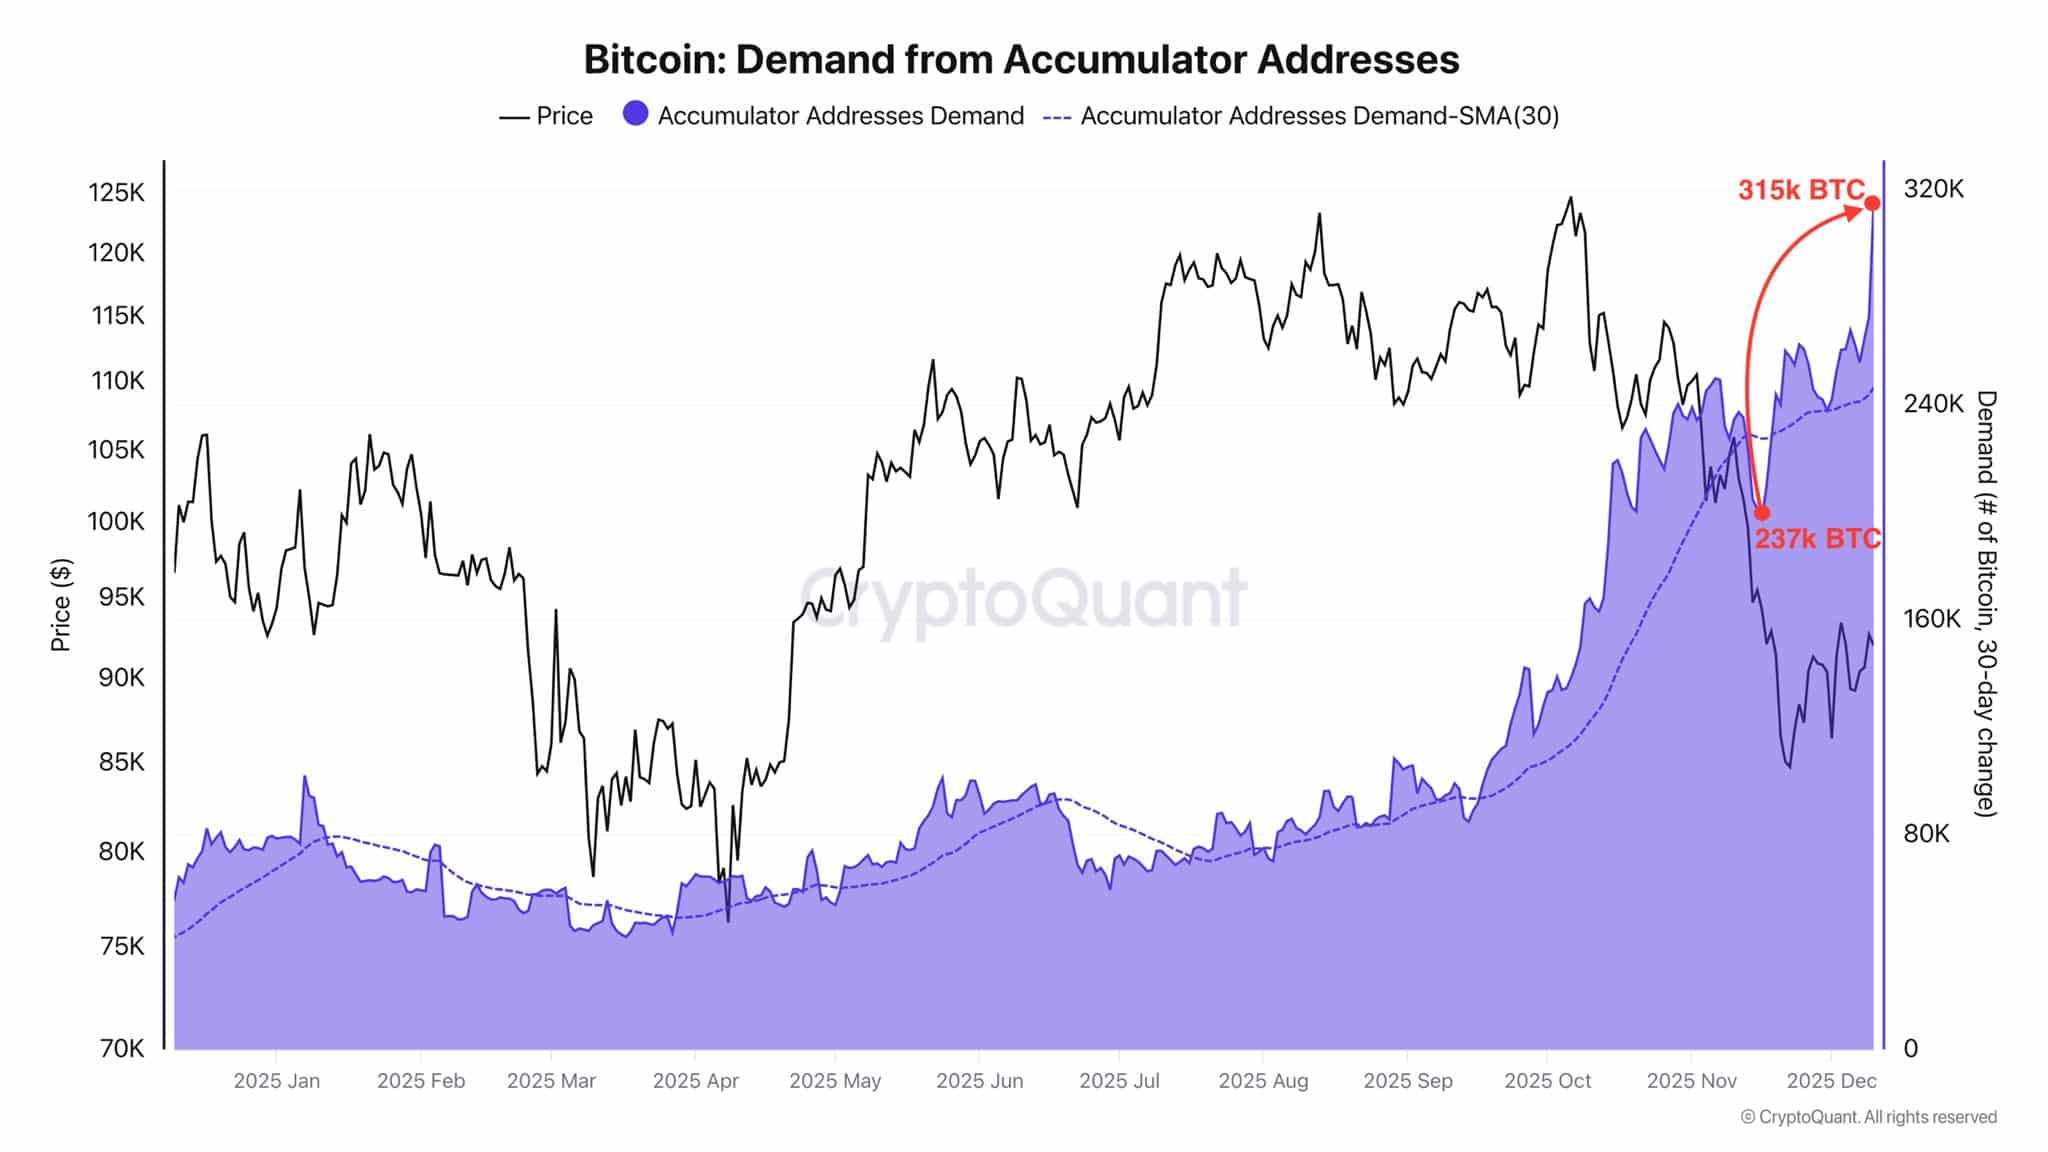
Accumulator addresses are typically defined by strict criteria, including the absence of outflows, consistent purchasing behavior, and a long-term history of activity. Accumulation at this scale often reflects growing confidence in price stability or expectations of a future rebound.
This shift in behavior followed comments from Federal Reserve Chair Jerome Powell indicating a rate cut and a more accommodative monetary stance during the latest FOMC briefing. Historically, such policy signals have supported demand for risk assets, including Bitcoin.
Bitcoin Derivatives Market Shows Improving Buy Pressure
Alongside spot accumulation, derivatives market data points to a gradual return of buyers. Bitcoin’s Spot Taker Cumulative Volume Delta over a 90-day timeframe shows that taker buyers have been increasingly active since September.
A positive taker-buy dominance suggests that market participants are more willing to buy at market prices, reflecting stronger short-term conviction. This stands in contrast to the earlier period when selling pressure dominated, with only brief moments of balance between buyers and sellers.
Funding rate data also supports this trend. At the time of analysis, CoinGlass reported a positive funding rate of 0.0067 percent, indicating that long positions slightly outweighed shorts. While the reading remains modest, it confirms a shift toward a more constructive market stance.
Liquidity Levels Define Near-Term Risk
To assess potential price movement, Bitcoin’s daily liquidation heatmap offers insight into areas of concentrated liquidity. Current data shows fewer liquidity clusters above the market price compared to levels below it.
This imbalance suggests that upward price movement may encounter less immediate resistance than a downward move. From the current price region around $92,464, Bitcoin appears to face lighter liquidity resistance up to the $97,000 area.
On the downside, stronger liquidity clusters are positioned near $89,000 and $88,000. These zones may act as demand areas if price revisits them, potentially slowing or reversing further declines depending on market sentiment.
Bitcoin Market Outlook Remains Data-Dependent
Bitcoin’s current setup reflects a convergence of renewed accumulation, improving derivatives activity, and a supportive macro backdrop. While consolidation continues, underlying demand signals suggest that market participants are positioning cautiously rather than exiting.
Whether this demand translates into a sustained breakout will depend on broader market conditions and the persistence of buying pressure in the weeks ahead.