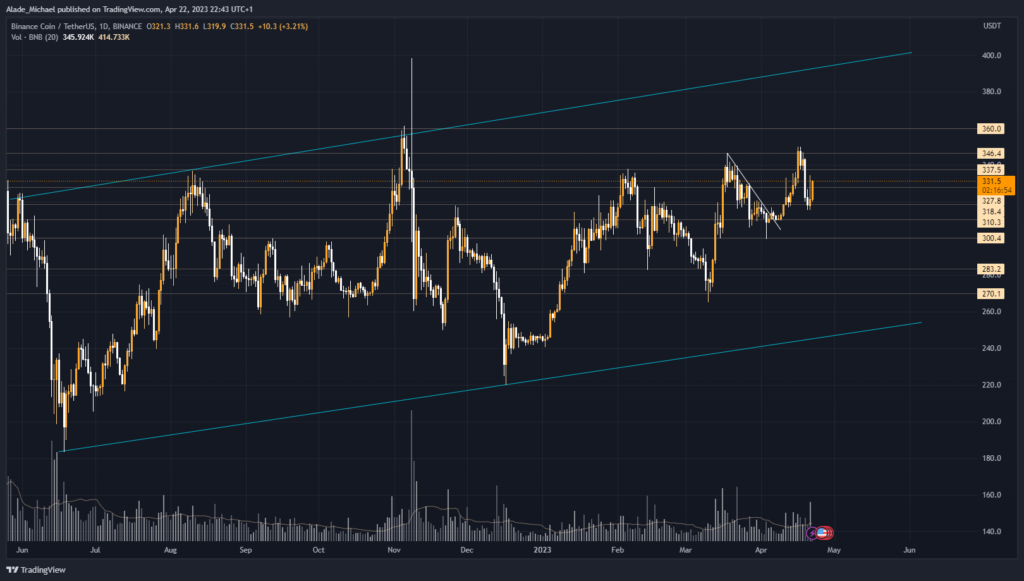
Binance Coin found temporal support and started to show signs of recovery yesterday. So far, the price has increased by 3.5% with a formed bullish pattern on the lower time frame.
Three weeks ago, BNB fell briefly below the crucial $300 level but saw a quick recovery after testing $299.5. This recovery led to roughly 18% growth in two weeks before it took a break last week.
This week came with a serious bearish sentiment after BNB precisely touched the $350 level as the current high of the month. It may print another high if the current price recovers last long.
From $315, which marked a low of the week yesterday, BNB has managed to bounce to where it trades at $331. Meanwhile, it has formed a bullish pattern on the lower time frame with a double-bottom formation. That setup could lead to a bullish reversal if the monthly high flips.
BNB is trying to retest the $340 level right now. A rejection at that level could trigger another sell-off to the current weekly low. But currently, the bulls are showing interest.
And if the weekly low fails to hold firm, the price could navigate the monthly low for support. Howbeit, the price continued to trade well inside the ascending channel since mid-2022. As we can see, BNB is bullish on the long-term perspective.
BNB Key Level To Watch

As the price starts to recover over the past hours, the $337.5 level remains the immediate resistance to watch. A full recovery above the monthly high of $350 could validate a rally to $360 and $370.
Should the asset resumes bearish, it will need to clear $318.4 and the mentioned weekly low before rolling over to $310 and $300.
Key Resistance Levels: $337.5, $346.4, $360
Key Support Levels: $318.4, $310, $300
- Spot Price: $331
- Trend: Bullish
- Volatility: Moderate
Disclosure: This is not trading or investment advice. Always do your research before buying any cryptocurrency or investing in any projects.
Image Source: olegkachura/123RF // Image Effects by Colorcinch


