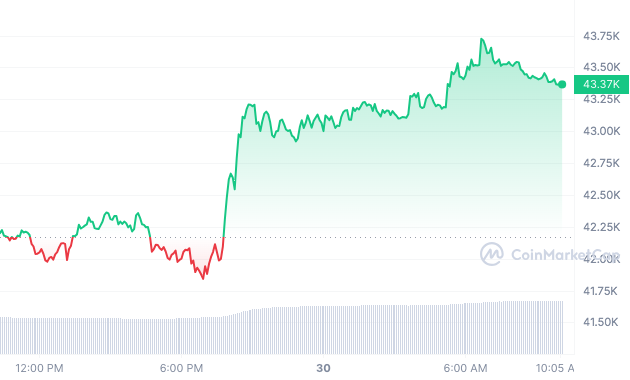
Investor sentiment is improving for Bitcoin (BTC), but it is too early to talk about a reversal in price movements.
Bitcoin’s Price After Google Lifts Crypto Ads Ban
Starting Monday, Google is allowing ads for certain cryptocurrency products, including Bitcoin exchange-traded funds (ETFs), on its search engine. The revised policy is consistent with the SEC’s recent approval of 11 spot BTC-ETFs. The leading asset is trading sideways just above $43,000. On the 4-hour chart, the pivot point is at $43,361. Above, there are resistance lines at $43,394, $44,372 and $45,581, which impede upward movement.
Support levels are located in the areas of $40,957, $39,644 and $38,618, which could potentially become an obstacle to the price decline. The relative strength index (RSI) is at 60, leaning towards bullish sentiment but not entering overbought territory. The 50-day exponential moving average (EMA) at $40,888 supports the current price, reinforcing the bullish sentiment.

Bitcoin’s trading pattern suggests fluctuations around $42,000. It faces resistance at $43,400, while the EMA and RSI indicators favours an uptrend.
Overall, the outlook for BTC is bullish as long as it remains above $43,000. But a fall below this level could signal a bearish reversal.
Bitcoin price regains short-term range
Bitcoin price fell after hitting a new yearly high of $49,000 on January 11, confirming the lower boundary of the ascending parallel channel as resistance.
Following this, BTC rebounded from the $41,000 horizontal area, which has acted as support since December 2023. If the growth continues, the resistance trend line of the previous channel will be at $45,000, which is 6% higher than the current price.
CredibleCrypto predicted a deviation below the low of the previous range, saying that the BTC price would rebound once it moved beyond it.
About 1000 $BTC in passive bids on Binance trying to get filled here.
400 BTC filled so far, around 600 left. Buyer is actively moving bids up under price in an attempt to get filled. pic.twitter.com/nR2T82GuRk
— CrediBULL Crypto (@CredibleCrypto) January 28, 2024
IncomeSharks was bullish on the break of the descending resistance trendline after the bounce. He wrote on X (Formerly Twitter): “I’m taking a swing trade here. Nothing special, just passing the time waiting for lower prices. I think we’re looking at a downtrend breakout on the 4-hour chart, and I’m keeping my stops in a tight range.”
Elliott Wave Theory Predicts a Bottom
Two other crypto traders used Elliott wave theory to predict BTC’s trajectory. XForceGlobal published a chart in which the price of BTC completed wave W of the WXY correction. If their assumptions are correct, Bitcoin will rise by about 5%, reaching the 0.5-0.618 Fibonacci level at $43,650-$44,900. This will be wave B in the ABC correction structure, after which it is expected to gain at least 12%, and possibly, and a 19% drop.
However, a decisive close above $44,900 signals that the correction is over. After this, the price of BTC could rise by 16% to its previous high of $49,000.


