Bitcoin [BTC] is making headlines again, but this time it’s not just for hitting new highs. The crypto king recently tumbled 4.28%, dragging prices back down to the $116,000 level. After riding a wave of bullish momentum to break $120,000, Bitcoin’s recent dip has left many wondering: is this a healthy pullback, or are bigger losses on the horizon?
Big Buyers Step In With $30 Billion, But Will They Stay?
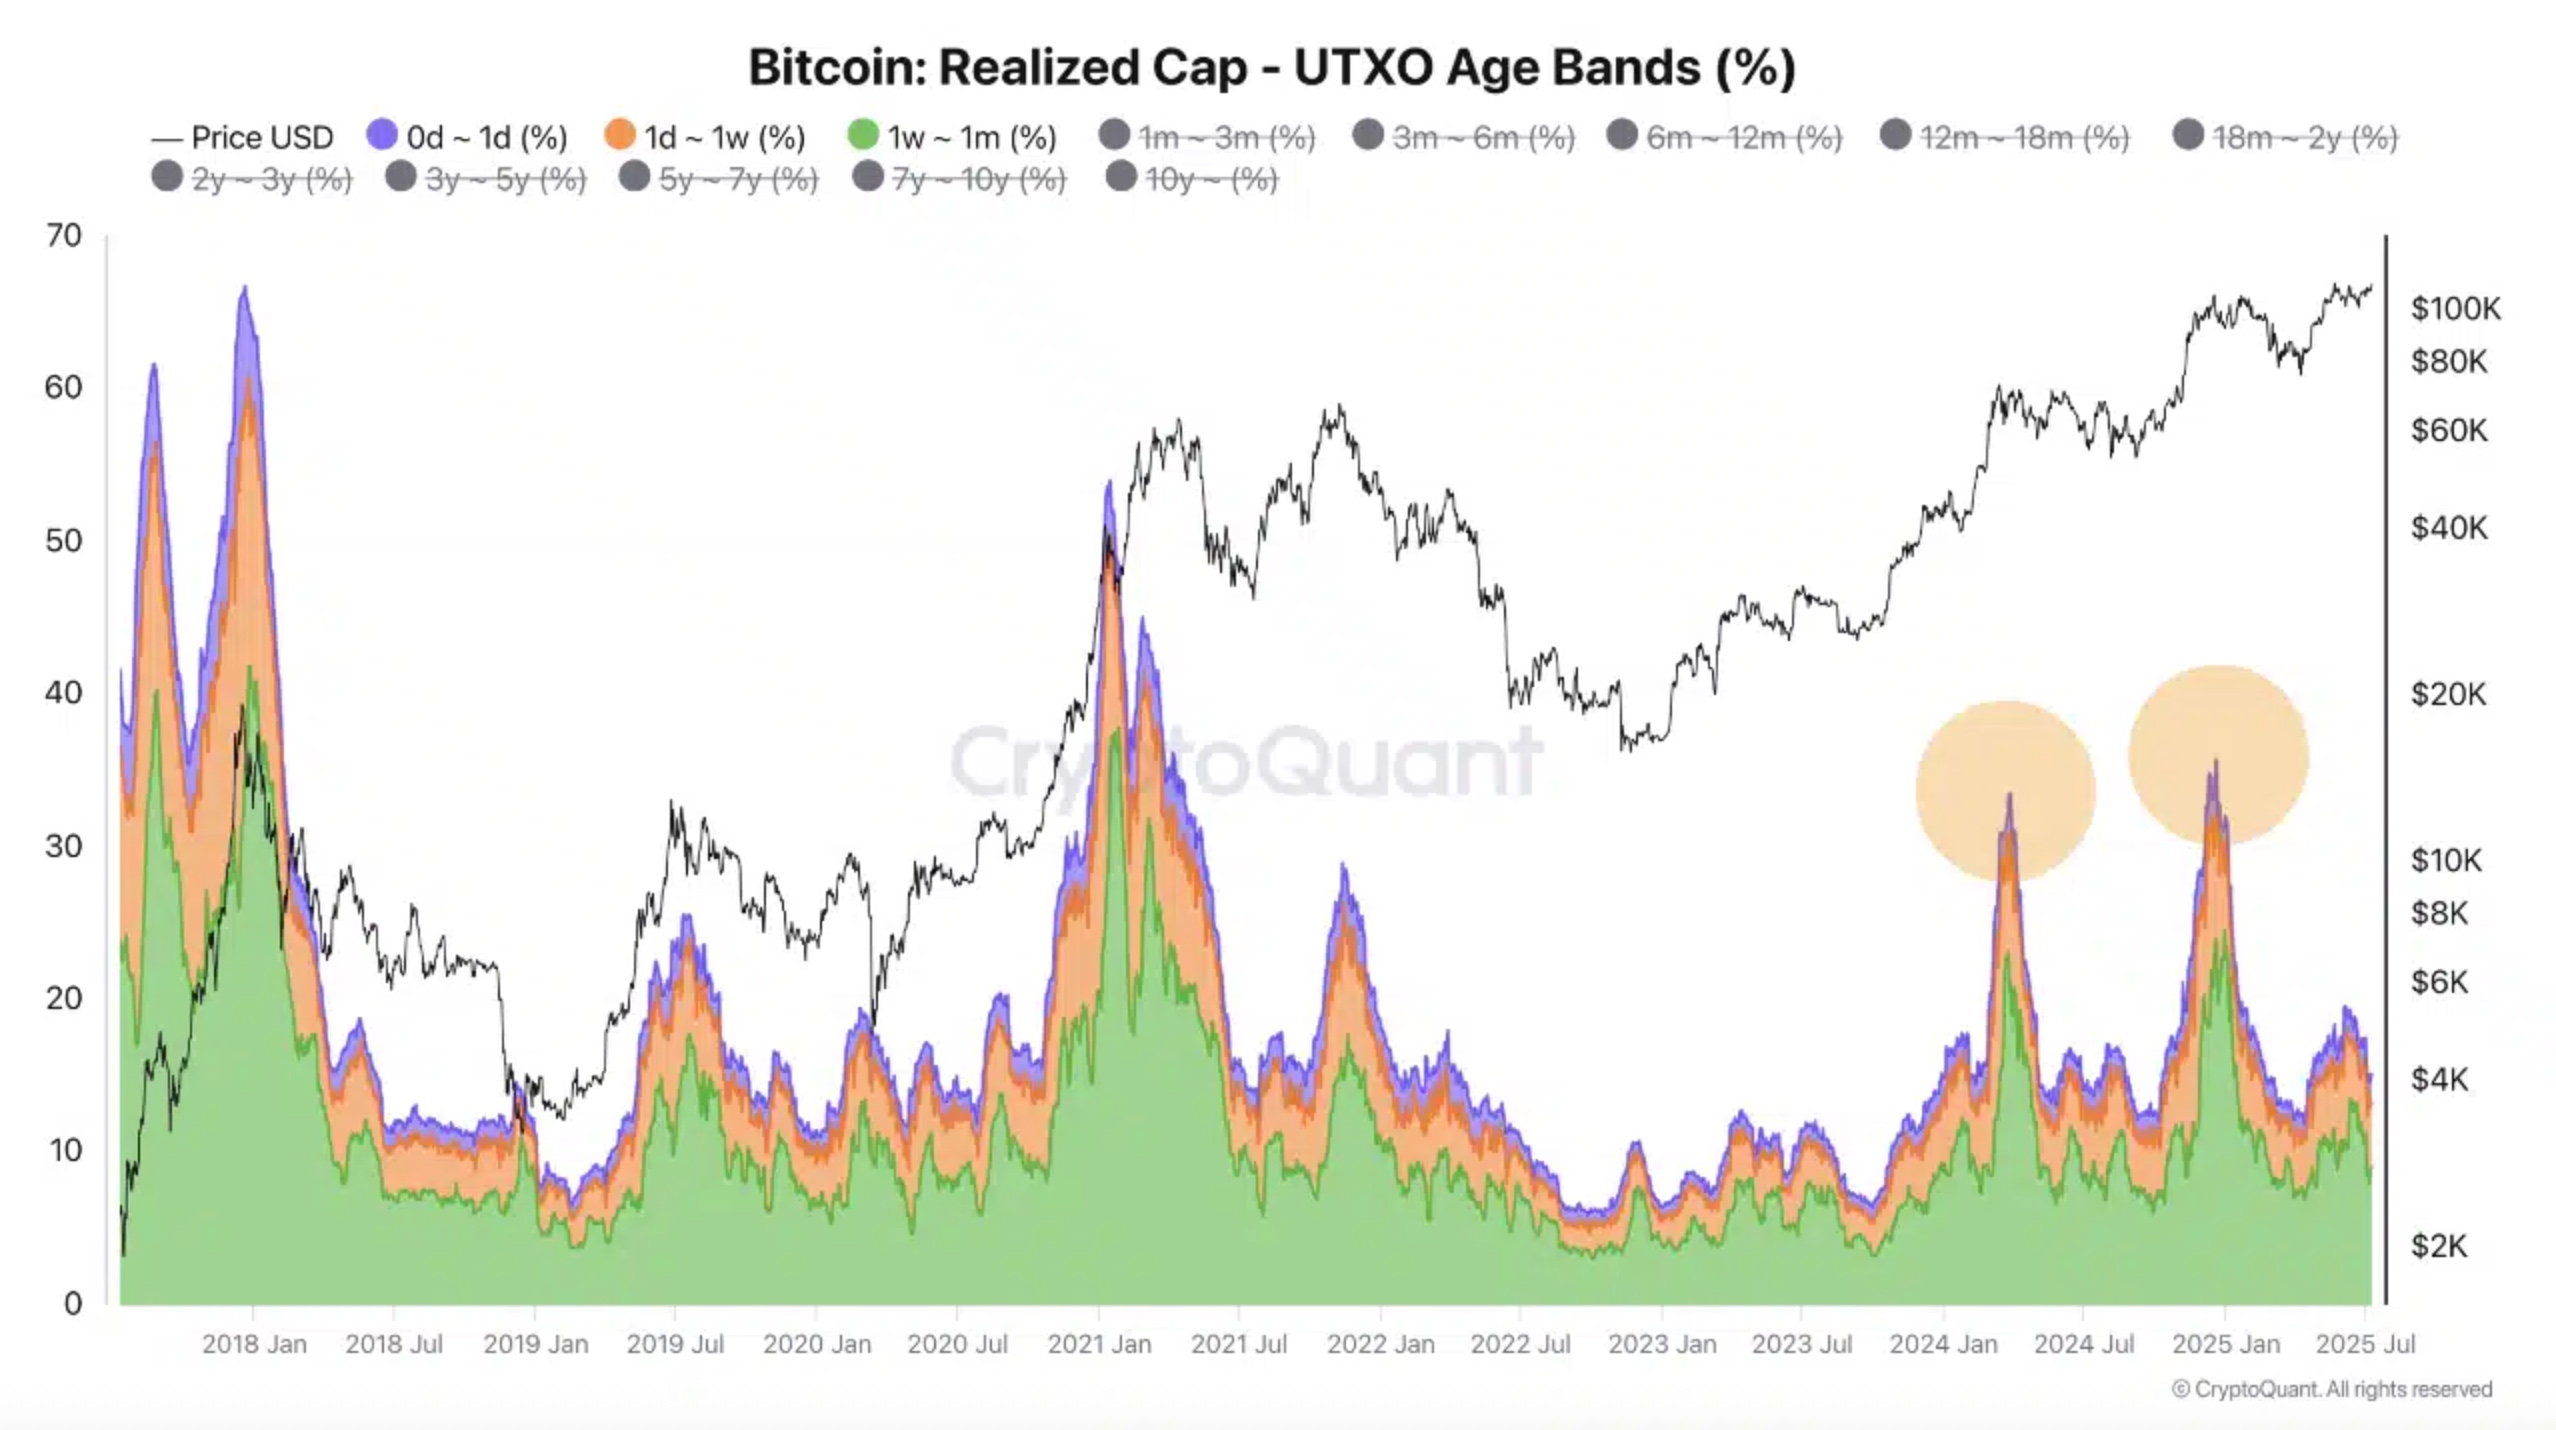
If you thought the bulls were done, think again. Bitcoin accumulator wallets, those infamous addresses that love to buy and hoard BTC without selling, have been busy. In the past 24 hours alone, these wallets gobbled up a staggering 248,000 BTC, valued north of $30 billion. According to CryptoQuant, this is the biggest single-day buy-in by this crowd all year.
In total, these accumulators have snapped up 164,000 BTC this month. But CryptoQuant analyst Darkforest issued a cautionary note:
“If BTC enters a phase of correction or consolidation, some of these addresses could start selling.”
If that happens, all this accumulation could quickly turn into distribution, and fast.
Profit-Takers Already On The Move For Bitcoin
While the accumulators were buying, others were cashing out. Glassnode data reveals a massive $3.5 billion in realized profits over the last 24 hours alone. Both long-term holders (LTHs) and short-term holders (STHs) participated in this sell-off. LTHs led the charge, accounting for $1.96 billion, or 56%, while STHs chipped in with $1.54 billion.

This wave of profit-taking is one of the largest we’ve seen this year, a worrying sign for anyone hoping for immediate upside. Historically, such sell-offs often foreshadow broader market corrections.
Bitcoin Technical Charts Warn Of More Pain Ahead
The charts aren’t offering much comfort either. A Gravestone Doji candlestick has appeared right at the recent peak, a classic warning sign for potential reversals. Bitcoin is also flirting with the upper band of the Bollinger Bands, hinting that it’s overbought.
Analysts are eyeing the demand zone between $115,000 and $111,000 as the next battleground. A midpoint target sits around $113,600, but the Bollinger Bands suggest we could see prices dip as far as $111,000 if sellers take control.
Leverage Could Be Bitcoin Undoing, Again
Leverage traders, it seems, never learn. CoinGlass’ 24-hour BTC/USDT Liquidation Heatmap reveals stacked liquidation clusters between $114,000 and $117,000. Below $115,000, leverage exposure gets even heavier.
Should Bitcoin fail to hold these levels, a sharp cascade toward $110,500 is on the cards. If that happens, even some of those so-called diamond hands might start feeling the heat.
The Road Ahead: Shakeout Or Setup For A Bounce?
Bitcoin’s future hinges on whether bulls can defend these critical levels or if profit-taking and leverage-induced sell-offs will drag prices lower. While the $30 billion accumulation shows serious conviction, history reminds us that markets love to test conviction, sometimes painfully.
For now, the next few days could tell us whether this is just a standard shakeout or something bigger brewing beneath the surface.


