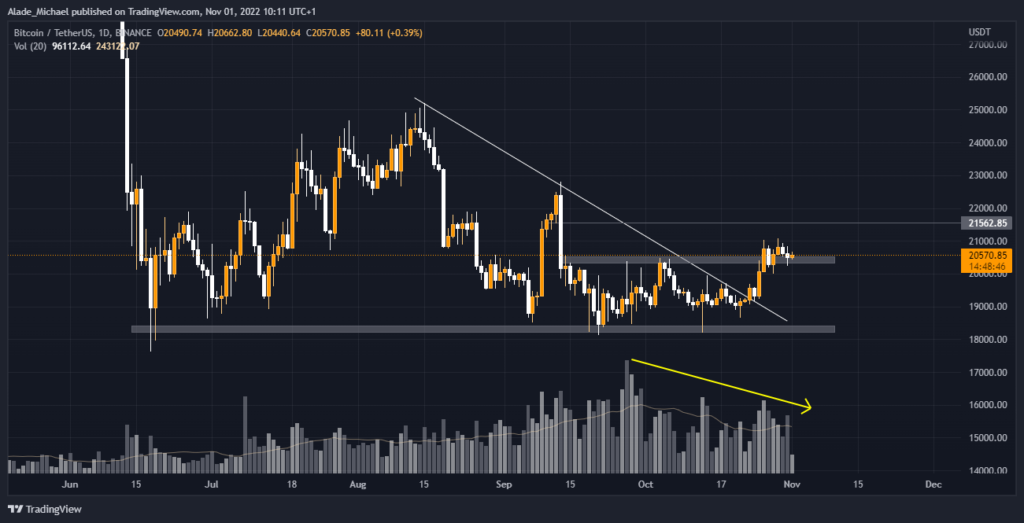
Following the latest increase in the overall market cap, Bitcoin’s price increased by 7% in the past 7 days as the bulls gain control. Although it appears the bears are trying to step back considering the double-top pattern on the micro level.
Bitcoin’s price has significantly increased since our previous analysis and as we can see, it’s still looking bullish from a mid-term perspective. The coin is now trading well above the $20k level after rebounding above the crucial $18000 level in October.
The double-bottom formation remains valid on the daily chart. Although, it has formed a double-top (bearish pattern) on the 4-hour chart due to the price rejection at the $21,000 level over the past weekend. This pattern indicates that a potential retracement could be underway.
A break below the holding $20k level should confirm a sell as it could lead to a nice retest of the late October breakout of the descending resistance line shown on the chart. On the other hand, we can expect the rally to continue if the 4-hour bearish pattern fails to play out.
Another indicator of this potential sell is the volume indicator, which continues to decrease by the day to show that bulls are losing control. The recent choppy candles suggest low trading volume as Bitcoin volatility shrinks.
However, Bitcoin’s setup currently looks dicey as the next price movement could take traders by a surprise. Whichever way it goes, we might need to pay attention to these key levels below.
Bitcoin Price Analysis (BTCUSDT) – Daily Chart

The $21,000 rejection level remains a key resistance for Bitcoin.
If it can manage to reclaim the above resistance, the next target resistance would be the $21,500 and $22,500 levels, respectively. The gains could reach $24,200 resistance if Bitcoin’s price continues to increase.
Looking at the latest double-top pattern, the first support to consider is the important $20k level as mentioned earlier above. Then followed by a breakdown to $19300 support and potentially $19,000 level.
In case Bitcoin dips further, the $18,200 level is the next support to look out for.
Key Resistance Levels: $21,000, $21,500, $22,500
Key Support Levels: $20,000, $19,300, $18,200
Spot Price: $20,570
Trend: Bullish
Volatility: Moderate
Disclosure: This is not trading or investment advice. Always do your research before buying any cryptocurrency or investing in any projects.
Follow us on Twitter @thevrsoldier to stay updated with the latest Metaverse, NFT, A.I., Cybersecurity, Supercomputer, and Cryptocurrency news!
Image Source: Amjith S on Unsplash // Image Effects by Colorcinch


