

Dogecoin is growing rapidly. Let’s look at whether it could double in price depending on various factors, including market sentiment and external events. Indicators are now pointing to bullish momentum, with the golden exponential moving average (EMA) crossover on the weekly DOGE chart indicating a bullish trend in the medium term. In addition, the meme coin has shown impressive growth against Bitcoin, strengthening by approximately 67.5% since February, despite the possibility of Bitcoin reaching a new all-time high (ATH).
Dogecoin Jumped 122.4% in February – Will the Trend Continue in March?
In just a month, the popular meme coin Dogecoin has spectacularly increased in price by 122%. A break of the golden ratio resistance at $0.12 opened the way for further gains, while significant Fibonacci resistance levels at $0.31 and $0.48 indicate 93% upside potential.
Looks like $DOGE is about to kickstart an explosive dog coin rally.
👀 on $FLOKI, $SHIB, and $BONK… likely to follow!
— Dogecoin Rise 🌎🚀🌕 (@DogecoinRise) March 3, 2024
A break above $0.48 would signal a new bullish trend that could see Dogecoin approach its all-time high at $0.74. The monthly moving average convergence divergence (MACD) histogram indicates an uptrend with a bullish MACD crossover while the RSI remains neutral.
DOGE: Golden Cross Confirmed
Dogecoin’s weekly chart confirms the bullish outlook as the EMAs formed a golden crossover, confirming the medium-term trend. Additionally, the MACD lines are also showing a bullish crossover and the MACD histogram is showing bullish momentum.
Despite last week’s strong bullish momentum, traders should exercise caution as the relative strength indicator (RSI) is in overbought territory on the weekly chart. However, it is important to note that there is no obvious bearish divergence in the RSI.
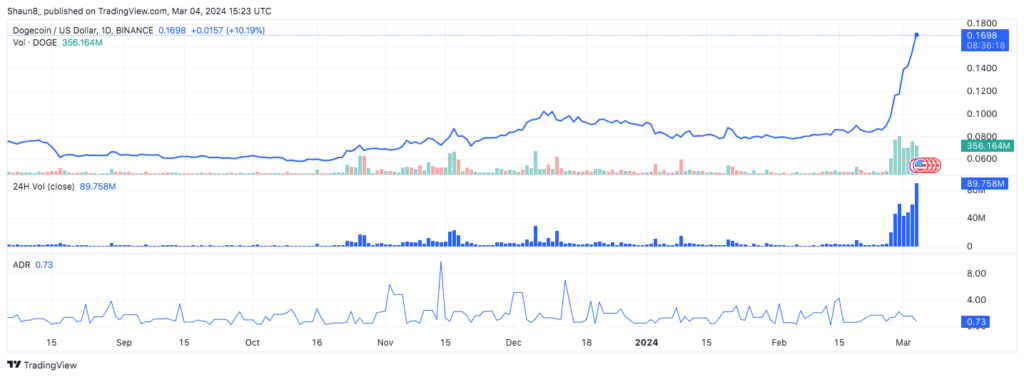
Dogecoin: Bullish Signals On The Daily Timeframe
The daily Dogecoin chart also shows a bullish trend, confirmed by the golden EMA crossover, indicating short-term and medium-term bullish sentiment. The MACD histogram is showing upward momentum and the MACD lines are forming a bullish crossover.
However, caution should be exercised as the RSI indicates severe overbought conditions. However, there are no signs of bearish divergence at the moment.
The 4-hour chart of Dogecoin shows bearish divergence amid a parallel ascending channel. However, the MACD lines maintain a bullish crossover and the MACD histogram shows upward momentum.
Moreover, the golden cross supports the short-term bullish trend. If a correction occurs, significant Fibonacci support levels are expected around $0.1263 and $0.098, with additional support coming from the 50- and 200-EMA of the 4-hour timeframe.
DOGE Price Prediction
Despite Bitcoin’s recent death cross indicating a medium-term bearish trend, Dogecoin has shown significant strength, jumping more than 67.5% over the past week. The MACD Histogram has turned bullish, the MACD lines have formed a bullish crossover, and the RSI is in neutral territory.
Resistance is currently represented by the 200-week EMA at 0.00000261 BTC, and a successful break of this could take the token to the next Fibonacci resistance levels at 0.00000389 BTC and 0.00000533 BTC.