

Dogecoin, or DOGE, is at a crucial point in its price movement. The price is hovering just above a key support level, and is forming a bearish pattern known as the descending triangle. This pattern suggests that there could be a potential breakdown, with the price possibly dropping to $0.145.
Dogecoin Forms Descending Triangle on the Chart
Looking at the daily chart, Dogecoin is forming a descending triangle pattern. This is a sign that the price action is slowly compressing as it gets closer to the tip of the triangle. The descending triangle is considered a bearish continuation pattern. It appears during a downtrend, and Dogecoin is trading well below the 200-day simple moving average (SMA), which is around $0.248. This shows that the trend is mostly downward for now.
Key Support Zone Near $0.165 – $0.17
One important level to watch is the horizontal support zone between $0.165 and $0.17. This is where Dogecoin has bounced a few times in the past. Right now, the price is testing this support again. The candles on the chart are small, and are forming just above this support zone, which aligns with the lower boundary of the descending triangle.
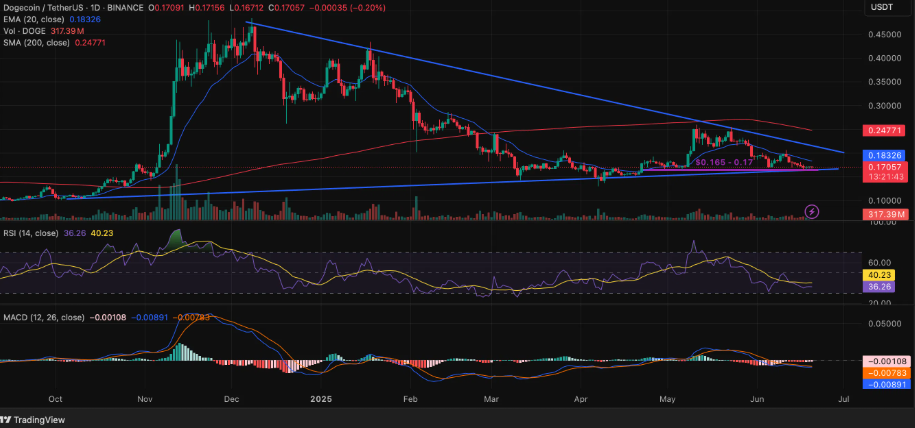
If the price falls below this support zone, it would signal a breakdown from the triangle pattern, which could lead to more selling. If this happens, Dogecoin might head towards the next major support level around $0.145, which is the previous demand zone within the triangle.
What Happens if Support Holds?
However, if the support zone between $0.165 and $0.17 holds strong, there is still a chance that Dogecoin might bounce back. It could continue to trade within this range for a while. But unless the price breaks above the descending trendline resistance and closes above it, the general outlook remains bearish.
Indicators Suggest a Bearish Scenario
Looking at some key indicators, it seems that the bearish scenario is more likely right now. The price is below both the short-term 20-day exponential moving average (EMA) and the long-term 200-day simple moving average (SMA). Both of these are trending downward, showing that the overall trend is not in Dogecoin’s favor.
The Relative Strength Index (RSI) is around 36, which is approaching oversold levels. This suggests that Dogecoin might be getting close to a point where it could be oversold and ready for a reversal, but there is no clear sign of that yet. The Moving Average Convergence Divergence (MACD) is still in negative territory. The MACD line is below the signal line, and there is no bullish crossover in sight.
What Could Happen Next to Dogecoin?
In conclusion, DOGE is at a critical level right now. If it breaks below the $0.165 level, it could move toward $0.145. On the other hand, if the support holds, there is still a chance for Dogecoin to bounce within the current range. However, unless there is a significant breakout above the trendline resistance, the overall sentiment remains bearish for Dogecoin in the short term.