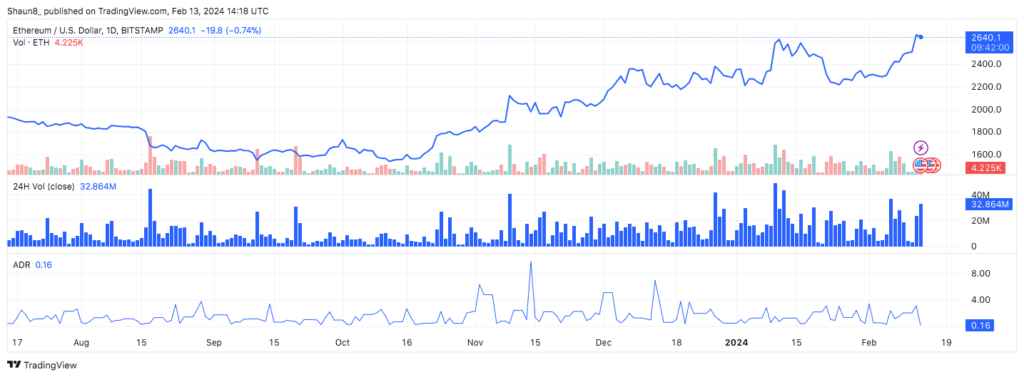
Last week, Ethereum ETH price rose above the long-term Fibonacci resistance line. However, the short-term Fibo level stopped the growth of the number 2 cryptocurrency.
Ethereum Crossed Above Fibonacci Resistance Level
The weekly chart shows that Ethereum has been rising since June 2022. The price made two rising lows, accelerating after each of them.
In November 2023, the token broke through a long-term horizontal resistance level, and in January 2024, it reached a high of $2,717. It is above the 0.382 Fibonacci retracement level. After a short correction, ETH rose above short-term Fib resistance, although it has not yet been able to update its annual high.
The weekly relative strength index (RSI) is giving mixed signals. The indicator is declining, but is still above the neutral level of 50. At the same time, it has formed a triple bearish divergence, which often precedes downward movements.
What Do Analysts Say?
Cryptocurrency traders and analysts on Platform X are positive about Ethereum’s potential.
InmortalCrypto believes the bear market accumulation is over:
Wake up honey, bear market accumulation is over.$ETH pic.twitter.com/cZ5t5UUOXJ
— Inmortal (@inmortalcrypto) February 11, 2024
However, OnChainDataNerd noted that the co-founder of Ethereum is allegedly selling part of his assets, and this is a wake-up call:
“15 hours ago,Ethereum co-founder Jeffrey Wilcke (@jeffehh) contributed $4,300 ETH ($10.7 million) to the #Kraken platform at a price of $2,482. It is noteworthy that the last time he transferred tokens to #Kraken ($22 thousand ETH or $41.1 million) at a price of $1870 was on June 5, 2023, just before the market collapse. Its current balance is 146 thousand $ETH ($362 million).”
Other well known analyst considers the long-term trend to be bullish. He sees the price breaking above $10,000 during the upcoming bull run, also he highlighted the recent short-term bullish breakout, predicting it will catalyze a move towards $3,000.
Where will ETH head first: $2,000 or $3,000
Neither the weekly chart, nor the daily timeframe does not confirm the direction of the trend. Although it shows that Ethereum has broken through the descending resistance line, the 0.618 Fibonacci retracement level triggered a price rebound from $2,510.

Despite the correction, the daily RSI rose above the neutral level of 50, indicating a bullish trend. If ETH breaks through the 0.618 Fib retracement level, we could expect a new yearly high. Due to the absence of further resistance levels on the chart, the price could rise by 35% in the longer-term. 618 Fib level at $3,350.
Meanwhile, a close below the intermediate support at $2,380 will jeopardize the upward move. In this case, Ethereum could fall 8% to the descending resistance line at $2,300.


