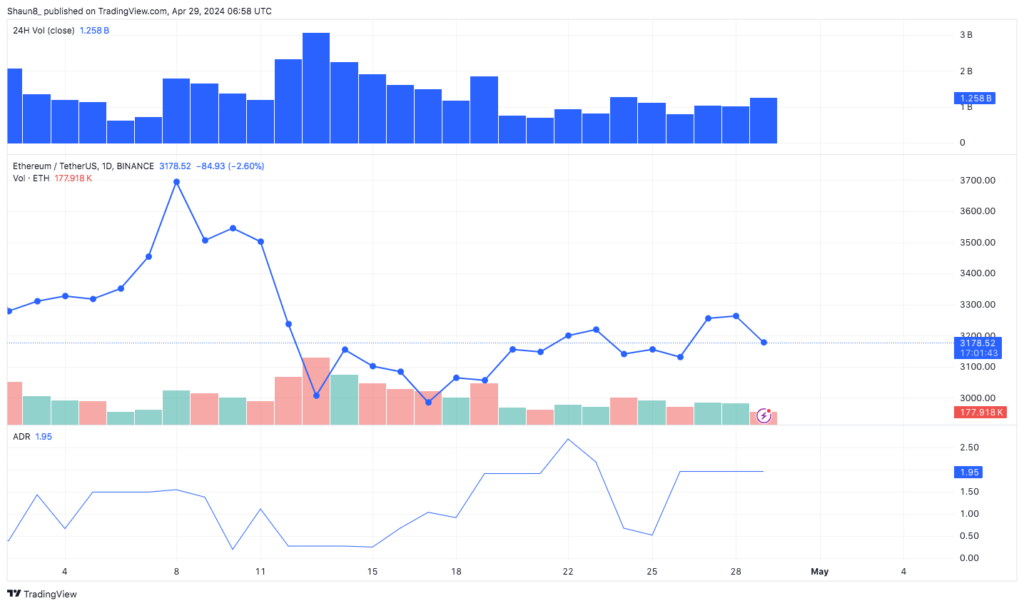
The world’s second-largest digital asset Ethereum (ETH) has faced recent selling pressure and is currently trading under $3,200. Furthermore, Ethereum on-chain indicators like a sudden drop in ETH gas costs hint at a decrease in network activity.
Ethereum Gas Fee Falls to 3-Year Low
Based on the latest data from Dune Analytics, ETH’s median gas price has hit a noteworthy milestone, reaching its lowest point in three years. As of April 27, the median gas price stood at a mere 6.43 gwei, marking the seventh lowest single-day gas median price recorded over the past three years.

Currently, the Ethereum Gas fee hovers around 5 gwei, reflecting the ongoing downward trend in gas prices on the ETH network.
Throughout trading history, traders have often oscillated between two emotional extremes regarding the future of cryptocurrencies: the bullish belief that prices are destined “To the Moon” and the bearish notion that “It Is Dead.” This sentiment shift often reflects in transaction fees, which typically peak (and occasionally deviate) around market tops, only to revert to normal levels during market bottoms.
 In the past six weeks, as markets have predominantly retraced, the diminished demand and network strain may act as catalysts to hasten the turnaround for Ethereum (ETH) and related altcoins. This suggests that a recovery in prices could materialize sooner than anticipated by many market participants, reports Santiment.
Whats happening to (ETH) Price?
During the weekend, the Ethereum price made a decent move above $3,300, however, failed to sustain the surge above its critical resistance of $3,400 levels.
On the hourly chart of ETH/USD, Ethereum experienced a significant break below a crucial bullish trend line, which had support at $3,150. Presently, ETH is trading below both $3,220 and the 100-hourly Simple Moving Average.

Nonetheless, bullish activity is evident around the $3,175 support level, along with the 61.8% Fibonacci retracement level of the upward movement from the $3,070 swing low to the $3,355 high. The immediate resistance lies near the $3,210 level, as well as the 100-hourly Simple Moving Average.
Should Ethereum fail to surpass the $3,210 resistance, a further downward trajectory may ensue. Initial downside support is anticipated around the $3,180 level, followed by a more substantial support zone near $3,165.
The primary support level is positioned around $3,070. A decisive breach below this crucial support level could potentially pave the way for additional losses all the way to $2,880. On the flip side, the chances of spot ETH ETF approval also seem to be dwindling with the SEC showing interest in discussing the investment product.


