

Ethereum stabilizes above breakout zone
Ethereum is holding above the $3,000 support area after breaking out of a long-standing descending channel, according to technical and on-chain indicators. The asset is consolidating below major resistance while maintaining structure above the former resistance level that has now flipped into support.
The breakout followed an impulsive rally that pushed ETH into a high-confluence resistance band. Subsequent selling pressure led to a series of bearish daily candles, but price action has remained above the lower boundary of the breakout range.
Momentum cools but structure holds
The Relative Strength Index has eased from overbought conditions into neutral territory, signaling reduced short-term momentum without invalidating the broader trend. Ethereum continues to trade above the daily trendline, which analysts view as a key level defining the current bullish structure.
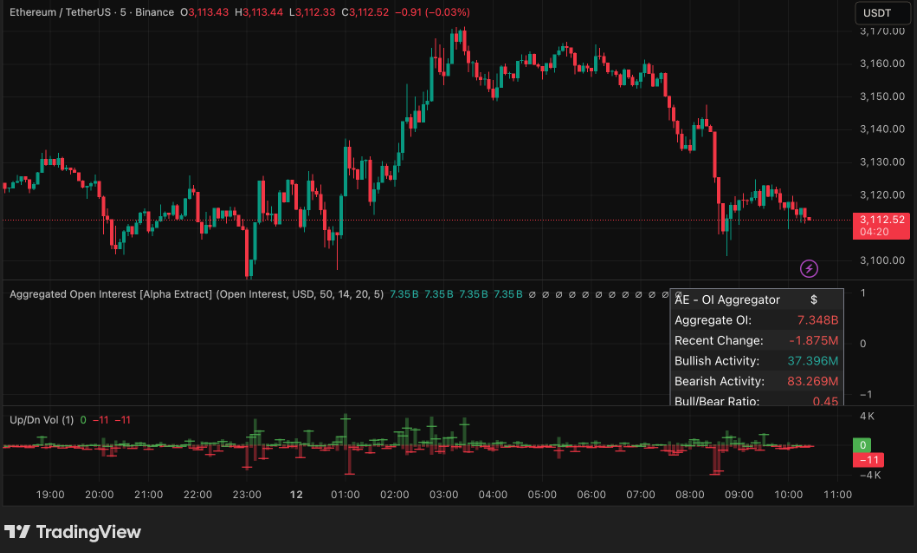
Shorter time frame charts show consolidation forming above the breakout area. This zone is now acting as a mid-range value area where buyers and sellers are reassessing direction. A sustained move above nearby resistance could reopen higher price targets, while a breakdown below support may lead to a retest of lower demand levels.
On-chain data points to improving demand
On-chain metrics indicate that Ethereum network activity is recovering. The 30-day simple moving average of active addresses has risen above 400,000, a level historically associated with periods of sustained market participation.
The increase follows a prolonged decline seen through the second half of 2024. Analysts link the recent recovery in address activity to renewed decentralized finance usage and restaking flows. In previous market cycles, rising active addresses have often coincided with broader price expansions.
Continued growth in network participation would strengthen the case for sustained medium-term demand, while declining activity could weaken the current technical structure.