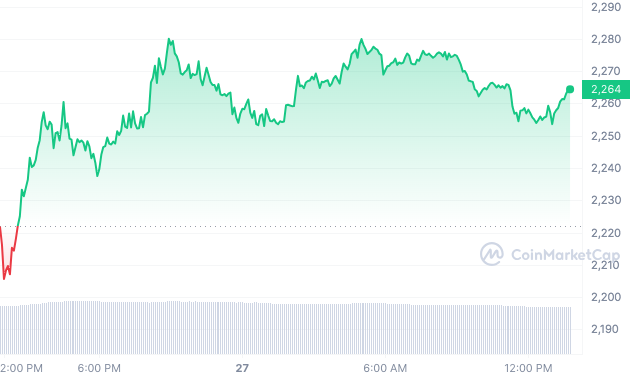
Ethereum started 2024 with a surge, reaching levels not seen since May 2022. However, ETH has been declining since January 12th and is now trading inside a minor horizontal support area.
Ethereum Has Lost Its Footing
The weekly timeframe shows that ETH has been rising along an ascending support line since July. The last time the price bounced off this trend line was October 2023, after which the rate of increase accelerated.
The subsequent upward movement led to a breakout of the horizontal area in November. With the exception of the deviation in April, this area has alternated between support and resistance for nearly 1,000 days.

Image source: coinmarketcap.com
Following the bullish breakout, ETH peaked at $2,717 on January 11. However, the price has fallen since then and is forming a bearish candle on the weekly timeframe.
The weekly relative strength index (RSI) is giving bearish signals. The indicator has formed a bearish divergence and is declining. This occurs when rising prices are accompanied by weakening momentum, often leading to a trend reversal.
What do analysts say?
Cryptocurrency analysts and traders on Platform X are unsure about the future trend of the coin. InmortalCrypto writes that Ethereum will fall in the short term, but then rise significantly.
CryptoMichNL suggests that ETH will rise against Bitcoin (BTC). He wrote:
“Momentum for $ETH is likely to emerge over the next few weeks. Arguments: Bitcoin hits bottom, this is a trigger for altcoins to make a new breakthrough; Hype around Ethereum spot ETF; Ethereum launches new upgrades to reduce costs by 90%.”. On the other hand, Inmortal seam positive about the current situation of the ETH.
However, CrediBULL Crypto believes that the ETH/BTC pair has not yet reached the bottom and will continue to fall.
Boom. Beautiful rejection on ETH/BTC as expected. May revisit those local highs but imo a full retrace of ETH/BTC is on the horizon as $BTC recovers from this recent correction and begins it’s next impulsive move to the upside, outperforming ETH once again.
As I have said before… https://t.co/HllnRI4Pee pic.twitter.com/uiOqcVvRBO
— CrediBULL Crypto (@CredibleCrypto) January 25, 2024
ETH Forecast: Will Support Hold?
The daily time frame gives bearish signals. On January 23, the price broke through the ascending support line, which was 95 days old. The daily RSI confirms this price breakout, simultaneously falling below 50.
Earlier, the RSI rose above 50, also simultaneously with the formation of this rising trend line.
| Note: A representative of the Ethereum Foundation announced the deployment of the Dencun update to the Sepolia and Holesky test networks. Previously, the Dencun hard fork was launched on the Goerli test network. |
ETH is currently trading inside the horizontal support zone of $2,200. If it breaks, the price could decline by almost 11% to the 618 Fibonacci retracement level at $1,980. Despite this bearish outlook, a vigorous bounce from the $2,200 support area could propel Ethereum to a 7% rally towards the ascending trendline at $2,400.


