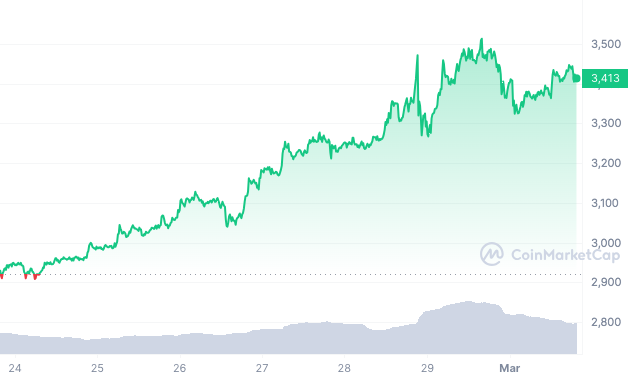
The Ethereum ETH price briefly surpassed the $3,500 mark, but failed to gain a foothold at new heights. During the upward movement, Ethereum (ETH) rose above the area of short-term and long-term resistance levels.
Ethereum (ETH) Reached $3,500
The weekly chart shows that ETH is trading inside an ascending parallel channel that appeared in June 2022. The ETH price made two breakout attempts, both of which were unsuccessful.
In February 2024, ETH finally managed to overcome resistance and rally above the middle of the long-term range limited by the levels of $1,400 – $4,000. Yesterday, ETH reached $3,522, its highest price since March 2022. Meanwhile, the weekly relative strength index (RSI) is giving bullish signals. Traders use RSI to understand whether an asset is worth accumulating or selling.
If the RSI is above 50 and the trend is up, the bulls still have the advantage, but a reading below 50 indicates that the bears are in control. Now the indicator is above 70 and growing – these are signs of a bullish trend.
What do analysts say?
Some crypto traders and analysts on social network X (formerly Twitter) believe this is just the beginning of a larger Ethereum trend. The chart published by Altstreetbets shows a wave analysis that indicates the possibility of ETH price rising to $5,500.
#ETH should run upto 4500$ before any major pullback. pic.twitter.com/5jc3HaXob0
— ᴀʟᴛꜱᴛʀᴇᴇᴛ ʙᴇᴛꜱ (@AltstreetBet) March 1, 2024
On the other hand, InmortalCrypto believes ETH will rise to $10,000, while others noted that its $3,500 target has already been reached. Byzantine General pointed out two factors that will lead to further strengthening of ETH. “But everyone is already full of ETH, it has nowhere else to grow.” No, buddy. Only a small, terminally ill portion of this niche community on Twitter has an overweight in ETH. This is, by and large, nothing,” he said.
ETH Price Prediction
Wave analysis and RSI signals on the daily chart support further growth of ETH. Technical analysts use Elliott Wave theory to determine trend direction by studying repeating long-term price patterns and investor psychology.

The most likely wave count suggests that ETH is in the third wave of a five-wave upward move. At the moment, the length of the third wave is 1.61 times longer than the length of the first. This is a potential top level. However, the daily RSI continues to rise and shows no signs of reversing. Thus, if ETH breaks the $3,640 resistance, there could be another 35% upside to the next $4,550 resistance, giving waves 1 and 3 a 1:2.61 ratio.
Despite the bullish outlook, failure to break above $3,640 could trigger a 13% decline to immediate support at $3,000, completing the fourth wave.


