Fantom (FTM) has been stuck in a consolidation phase for some time, leaving investors wondering if the correction is finally over. While the price hasn’t shown any major directional movement lately, some on-chain metrics are starting to flicker green, hinting at a potential breakout from this sideways trend.
FTM Holds Above Key Support Level
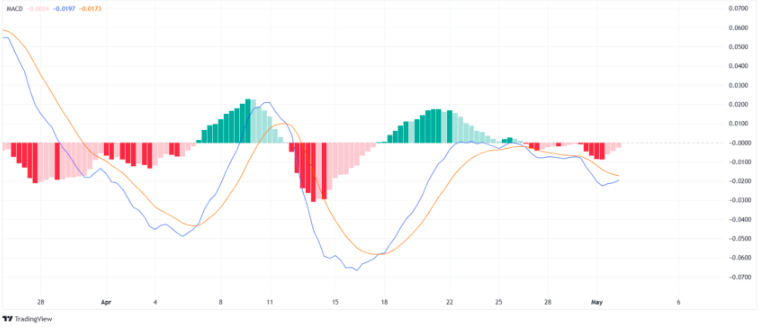
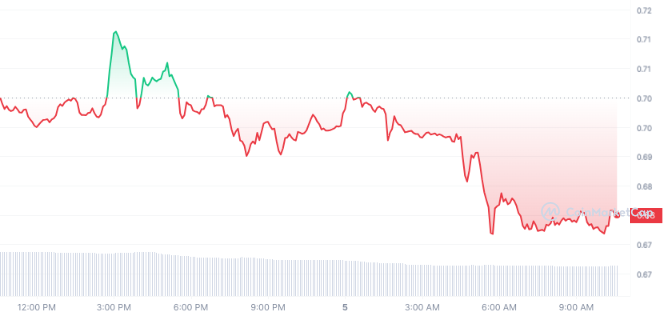
One positive sign is FTM’s ability to hold above the crucial $0.63 support level. This level has been tested multiple times this year and has held strong since early March. This indicates that there may be underlying buying pressure keeping the price from falling further. The Moving Average Convergence Divergence (MACD) indicator is sending bullish signals for Fantom.
This technical analysis tool measures the relationship between two moving averages of an asset’s price. When the indicator line crosses above the signal line, it’s often interpreted as a bullish crossover, suggesting a potential rise in price. While a crossover hasn’t happened yet, it’s something to keep an eye on for confirmation of a potential uptrend.
Fantom: Daily Active Addresses Hint at Increased Interest

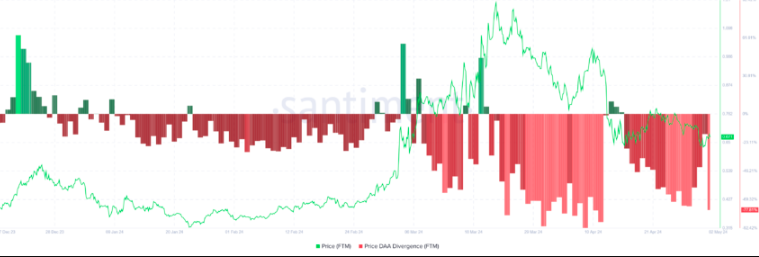
Another encouraging sign comes from the Daily Active Address (DAA) indicator. This metric tracks the number of unique wallets interacting with the Fantom network on a daily basis. An increase in active addresses during a price decline is generally seen as a bullish signal, suggesting that even though the price is down, there’s still activity and potentially buying pressure from new investors entering the market.

FTM Price Prediction
While these signals are positive, it’s important to maintain a measured approach. Even if FTM initiates a new rally, it’s likely to face resistance at the $0.79-$0.88 block, which has previously acted as both support and resistance. A successful breakout above this zone would be a more definitive sign of a sustained upward trend.

The broader market sentiment will also play a key role in FTM’s future trajectory. If the overall crypto market experiences a bullish run, it could propel FTM higher. However, a negative shift in the market could send FTM back down to the $0.63 support level. If that level breaks, a further decline towards $0.55 becomes a possibility. The on-chain metrics for Fantom suggest that a turnaround for FTM might be brewing. However, investors should closely monitor the price action, particularly the MACD crossover and resistance levels, to confirm a bullish trend. Keeping an eye on the broader market sentiment is also crucial for making informed investment decisions.


