
In today’s analysis, we will examine Litecoin (LTC) recent price action and its on-chain activity to understand the underlying trends and potential future mid-term movements. On the other hand, Bitcoin’s struggles to break the $61K price level have put pressure on LTC, leading it to trade below the critical $80 support level. What’s driving this behavior? Let’s examine the details.
Litecoin (LTC) is Trading Just Above a Critical Support Level
In the chart below, we observe Litecoin’s price action in the 4-hour timeframe. However, the red lines highlight key support and resistance levels. Currently, the price is around $79. A decline below the $75 range could trigger a cascade of liquidations, leading to further price depreciation.
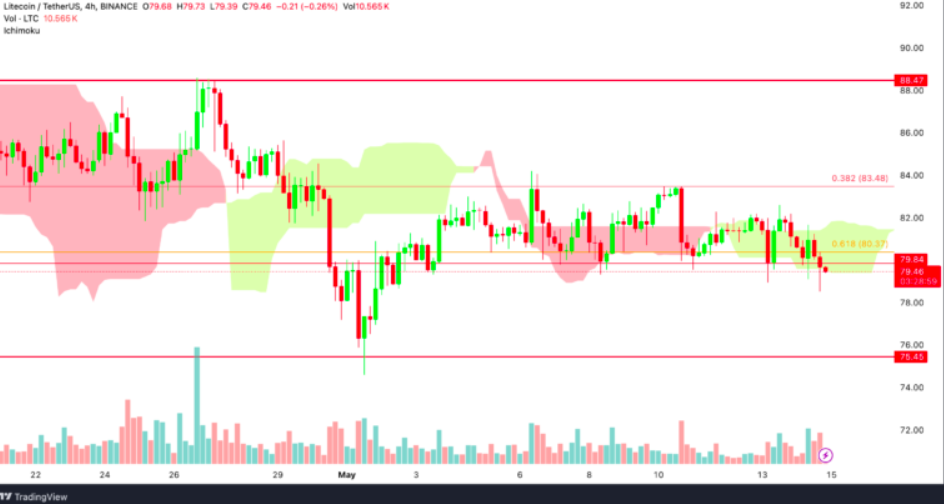
The $80.37 level, near the $80 mark, aligns with the 0.618 Fibonacci retracement level and is crucial mid-term support.
Litecoin’s price recently attempted to break below the 4-hour Ichimoku Cloud. In addition, If the price closes below the cloud, this could trigger increased volatility and lead to a continued mid-term price correction to $75. However, If the price refuses to break above the cloud, it could signal a potential trend reversal.
Spent Volume Age Bands (SVAB) Reveals Key Market Trends
The provided charts show spent outputs segmented by age bands. Moreover, the green bars represent LTC held for 1 hour to 24 hours before being spent, blue bars indicate LTC held for 1 day to 1 week before being spent, light green bars show LTC held for 1 week to 1 month before being spent, and red bars reflect LTC held for 1 month to 3 months before being spent. Meanwhile, the black line represents the LTC price in USD.
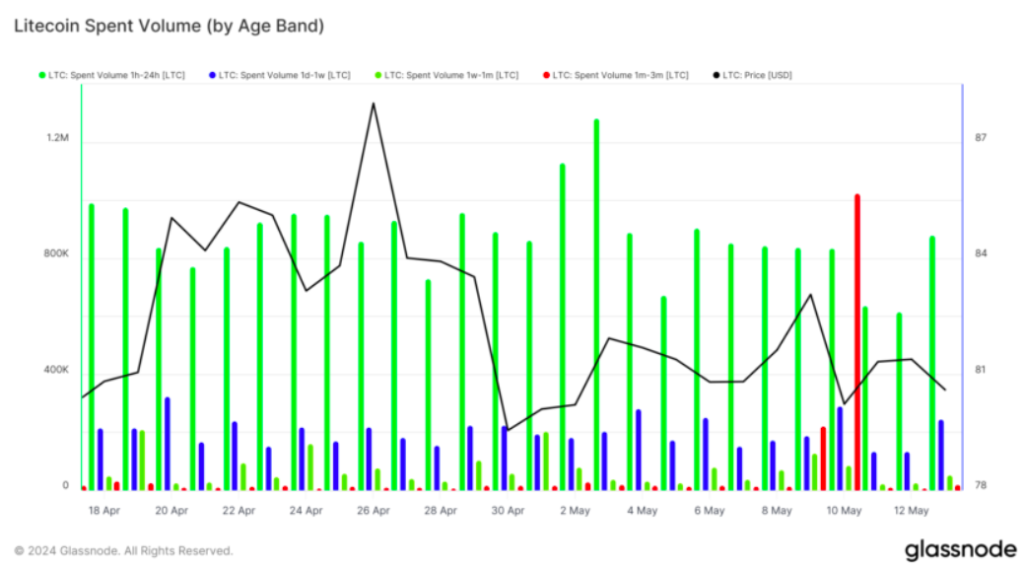
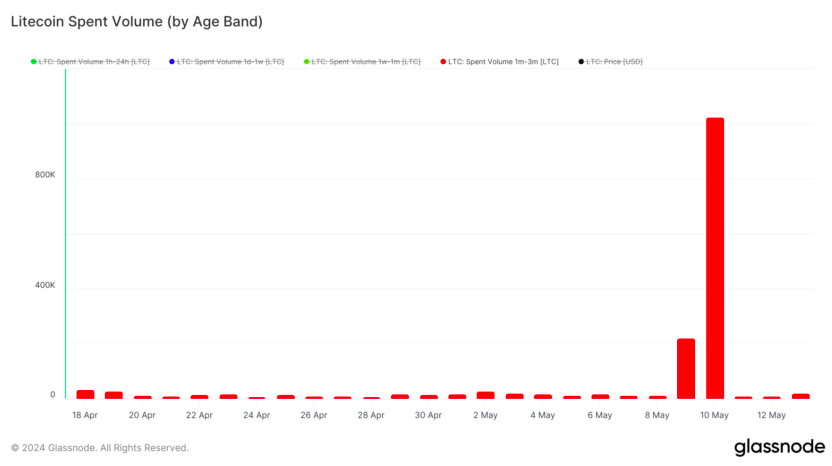
The most volume is spent within 1 hour to 24 hours (on average, 800K LTC is spent per day), indicating a lot of short-term trading activities. In addition, this rapid trading activity can make the price more volatile. On the other hand, on May 10, there was a significant sell-off by mid-term holders, those holding LTC for 1 to 3 months. This might indicate a change in sentiment or profit-taking behavior. Such spikes can lead to mid-term price drops.
Strategic Decision-Making and Outlook for Litecoin
Bearish to Neutral Outlook
LTC’s price struggles below the $80 support level, showing weakness after Bitcoin’s challenges at the $61,000 mark. However, this has led to fear among holders, with short-term investors exiting to cut losses.
Conditional Support
Should Bitcoin fall below 61,000, LTC might experience a notable mid-term price decline to $75.
Price Projections and Recommendations
In a bearish scenario, LTC could fall to $70 if Bitcoin’s price declines to 59K. In addition, to reduce risk exposure, traders should wait for the price to drop below $75 before buying. Meanwhile, the ideal buy range would be around $70-$72 for an optimal entry position. Moreover, setting a stop-loss at $68 is advisable to manage potential downside risks and aim for a sell price of $85-$90 to capitalize on the next upward wave.