Despite the impressive jump from $6.4 to $7.1, Polkadot (DOT) uptrend is still not sustainable. In addition, using on-chain metrics and technical indicators, we figure out what to expect from altcoin dynamics in the near future.
Polkadot (DOT) Charts Signal Potential Price Correction
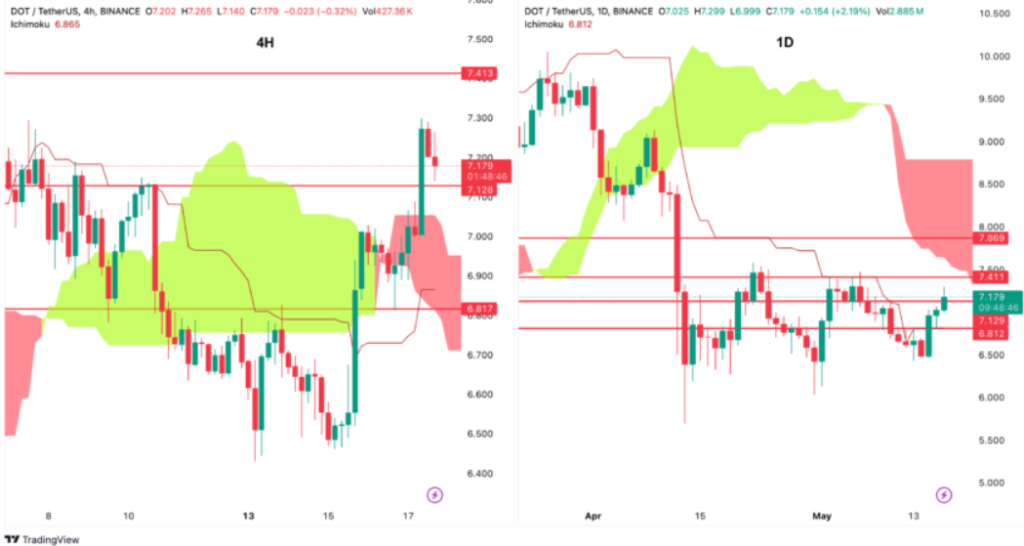
The Ichimoku Cloud is a technical analysis tool that consists of several indicators. It provides insight into potential support and resistance zones and is also used to predict the future trend. However, the chart below shows that DOT has broken above the 4-hour Ichimoku cloud. A return to it may signal a trend reversal. On the daily timeframe, the altcoin price is approaching the lower boundary of the cloud.

On-chain data, meanwhile, is showing alarming trends. The number of new Polkadot addresses has dropped significantly, hinting at a loss of investor interest in the asset.

Number of new DOT addresses . Source: IntoTheBlock
However, a sustained decline in the number of new addresses can impact the overall health and expansion of the ecosystem. In the context of Polkadot, this decline could mean several things:
-Declining activity among existing users due to a lack of interesting projects, updates, or incentives to maintain engagement.
-Growing bearish sentiment in the broader market.
-Challenges in maintaining the project’s unique value proposition relative to other solutions.
The chart below shows the 7-day moving average (7DMA) of daily transactions on the network. After reaching a peak in January 2024, their numbers have been steadily declining.

A drop in activity often correlates with a decrease in overall network usage, and as a result, a decrease in demand for the native token.
What to Expect from (DOT) Price?
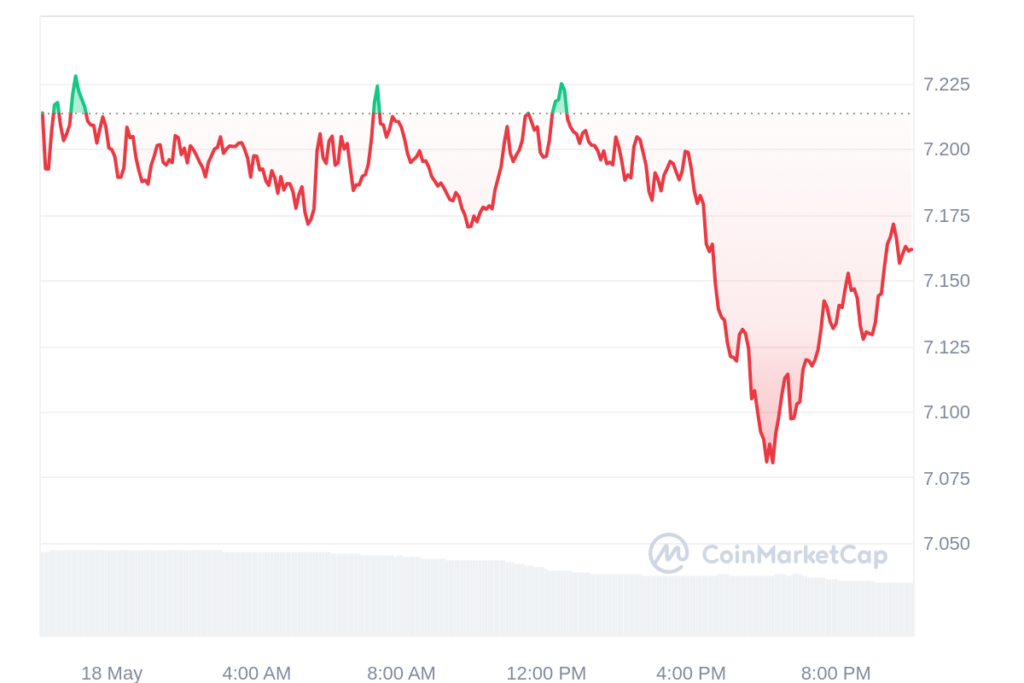
At the writing time, Polkadot price is trading at $7.16 according to coinmarketcap. However, Polkadot showed an uptrend, breaking above the 4-hour Ichimoku cloud. This technical pattern indicates potential bullish momentum. However, traders should be careful as a pullback to the cloud on the 4-hour timeframe could signal a trend reversal. 
coinmarketcapDOT’s recent uptrend is heavily influenced by broader market movements, particularly the rise in the price of Bitcoin. In addition, the dynamics of the altcoin were greatly facilitated by speculative activity around derivative contracts. Moreover, while technical indicators point to bullish momentum, on-chain data hints at potential risks. Declines in the number of active addresses and transaction volume signal that investors are choosing to stay on the sidelines.


