• About
  • Contact
  • Privacy Policy
  • Terms and Conditions
Thursday, September 11, 2025
The VR Soldier
  • Featured
  • News
  • Education
  • NEAR Protocol
  • Solana
  • Fantom
  • Yield Farming
  • Reviews
  • Press Releases
No Result
View All Result
  • Featured
  • News
  • Education
  • NEAR Protocol
  • Solana
  • Fantom
  • Yield Farming
  • Reviews
  • Press Releases
No Result
View All Result
The VR Soldier
No Result
View All Result

Polygon Price Analysis & Prediction (April 25th) – MATIC Plunges to Critical Trading Level, Looks for Break or Make

Michael Fasogbon by Michael Fasogbon
April 25, 2023
in News
Reading Time: 2 mins read
0
polygon price analysis prediction

Polygon (MATIC)

18
SHARES
Share on TwitterShare on Facebook

Polygon‘s MATIC lost momentum this week and fell to a critical trading level. The weekly 17% loss has brought the price to a key support level where the next direction of the market would be determined.

After a series of higher highs and higher lows in the past ten months, Matic has once again dropped to the lower boundary of the wedge – looking for solid support. It currently trades at $1

As we can see in the chart below, the price seems to be respecting the wedge right now while on the verge of dropping further. This could result in a mid-term bearish if the price successfully breaks through.

Because this lower boundary has been providing a rebound in the past months, Matic may repeat the pattern and regain momentum in the next few days. Let’s say a bounce is produced, it must reclaim the $1.2 level to validate an uptrend.

Failure to reclaim that level could put the asset at a high risk of breaking below the wedge. And if that happens any moment from now, the key level to watch for drops would be $0.65. As of now, Matic looks bearish but there’s hope for a recovery.

MATIC’s Key Levels To Watch

polygon price analysis prediction
Source: Tradingview

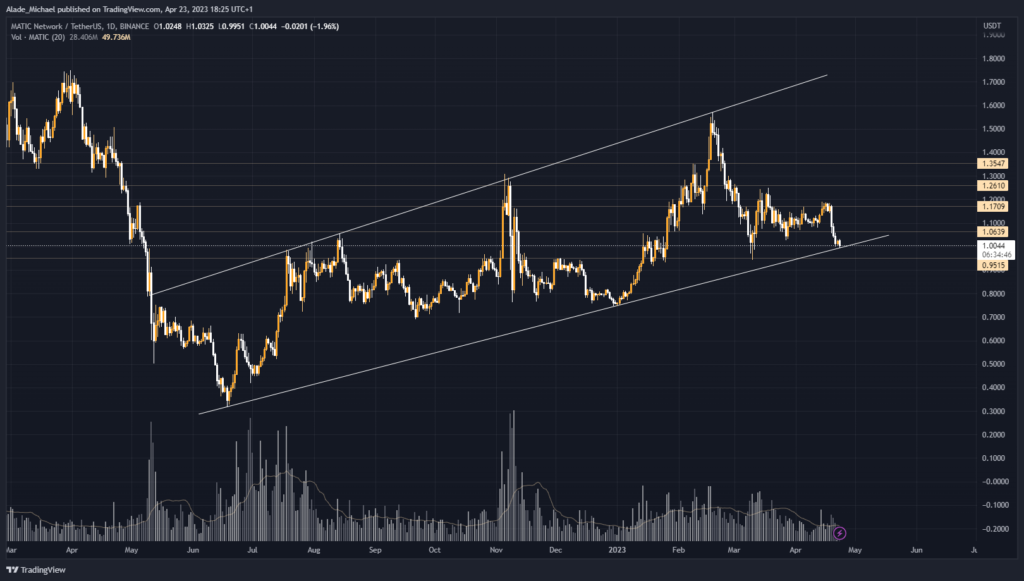
While anticipating the next move, the closest support level to watch for a breakdown is March’s low of $0.95. It is then followed by the $0.87 and $0.82 support levels before slipping lower.

However, if the price bounces back, the first resistance level to overcome lies at the $1.06 level, followed by $1.17 and $1.19 on the hourly chart. The higher resistance levels to watch next are $1.26 and $1.354 before rallying to the upper boundary of the wedge at full speed.

Key Resistance Levels: $1.06, $1.17, $1.26

Key Support Levels: $0.95, $0.87, $0.82

  • Spot Price: $1
  • Trend: Bearish
  • Volatility: High

Disclosure: This is not trading or investment advice. Always do your research before buying any cryptocurrency or investing in any projects.

Image Source: moxumbic/123RF // Image Effects by Colorcinch

Tags: Polygon
Previous Post

Avalanche Price Analysis & Prediction (April 25th) – AVAX Stays Calm After a Three-Day Steady Drop, a Recovery is Likely Soon

Next Post

Dogecoin Price Analysis & Prediction (April 25th) – DOGE Consolidates After Shedding 11% Loses in 7 Days, What Next?

Related Posts

Altcoin Season Index Soars to 76 While Bitcoin Dominance Wobbles
Market Analysis

Altcoin Season Index Soars to 76 While Bitcoin Dominance Wobbles

September 11, 2025
Ethereum $4.3K Balancing Act: Support or Sneaky Trap?
Market Analysis

Ethereum $4.3K Balancing Act: Support or Sneaky Trap?

September 10, 2025
U.S. Pushes Forward With Strategic Bitcoin Reserve Talks
Market Analysis

U.S. Pushes Forward With Strategic Bitcoin Reserve Talks

September 10, 2025
Bitcoin’s $111K Line in the Sand Faces Serious Pressure
News

Bitcoin $111K Line in the Sand Faces Serious Pressure

September 10, 2025
XRP Aims for $4 as ETF Buzz Heats Up: Can the Hype Hold?
News

XRP Aims for $4 as ETF Buzz Heats Up: Can the Hype Hold?

September 10, 2025
Featured

Ethereum ETFs See $1B Outflows in Six Days

September 9, 2025

Press Releases

XRP Aims for $4 as ETF Buzz Heats Up: Can the Hype Hold?
News

XRP Aims for $4 as ETF Buzz Heats Up: Can the Hype Hold?

by Alex Mercer
September 10, 2025

Ripple’s XRP is flirting with the $3 mark again, thanks to a tidal wave of speculation around a potential ETF...

Read more
Bitcoin 12.8% Dip Looks More Like Flexing Than Failing

Bitcoin 12.8% Dip Looks More Like Flexing Than Failing

September 2, 2025
Whales Stack Nearly $1B in XRP – Is $4 Now on the Horizon?

Whales Stack Nearly $1B in XRP – Is $4 Now on the Horizon?

September 1, 2025
Why Ethereum ATH Could Crush Bears Before Q3 Ends

Why Ethereum ATH Could Crush Bears Before Q3 Ends

August 12, 2025
Ethereum’s 28-Day Countdown: Will Ethereum Smash Through $3,030 Next?

Ethereum 28-Day Countdown: Will Ethereum Smash Through $3,030 Next?

July 20, 2025
The VR Soldier

© 2024 The VR Soldier

Navigate Site

  • About
  • Contact
  • Privacy Policy
  • Terms and Conditions

Follow Us

No Result
View All Result
  • Featured
  • News
  • Education
  • NEAR Protocol
  • Solana
  • Fantom
  • Yield Farming
  • Reviews
  • Press Releases

© 2024 The VR Soldier