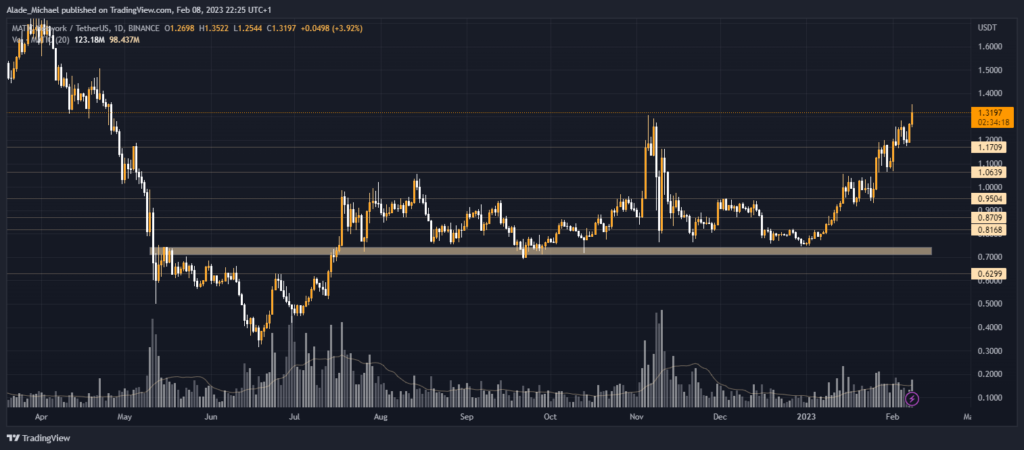
Polygon’s MATIC extended price movement to the upside after initiating a fresh buy yesterday. It cracked a major resistance level and marked a daily high about it. Bears remain in disbelief.
Many traders and investors have patiently waited for MATIC to provide a sizeable discount over the past weeks. But it appears the correction is taking longer than expected as it continued to gain momentum weekly.
It has continued to take the bears by surprise following this week’s fresh buy, which put the trend more in favor of the buyers. In fact, the short-term rally seems to have extended upward from a technical perspective.
Just at the close of the London session today, MATIC witnessed a spike and took out several stops on the hourly chart following a sudden dive in Bitcoin’s price. It rapidly regained momentum afterward and traded conveniently above $1.3.
The bullish pattern now looks so strong across all time frames. The price touched a daily high of $1.35 before pulling slightly lower. Once it retakes this high, we should expect price movement to higher price levels.
While the cryptocurrency rallied roughly 63% steadily for six weeks, the price is still down by 34% in a year. We can expect more recovery to happen if the extension continues.
MATIC’s Key Levels To Watch

As MATIC continues to trade well above the $1.3 support, the level to watch above the current daily high is $1.4. The resistance to watch above it lies at the $1.5 level.
MATIC now sits on weekly support of $1.17. Before that lies close support at $1.24 on the hourly chart. If all these mentioned prices no longer act as supports, the next area of interest would be $1.06, $1, and majorly $0.95.
Key Resistance Levels: $1.35, $1.4, $1.5
Key Support Levels: $1.17, $1.06, $0.95
- Spot Price: $1.315
- Trend: Bullish
- Volatility: High
Disclosure: This is not trading or investment advice. Always do your research before buying any cryptocurrency or investing in any projects.
Image Source: kviztln/123RF // Image Effects by Colorcinch


