• About
  • Contact
  • Privacy Policy
  • Terms and Conditions
Tuesday, September 16, 2025
The VR Soldier
  • Featured
  • News
  • Education
  • NEAR Protocol
  • Solana
  • Fantom
  • Yield Farming
  • Reviews
  • Press Releases
No Result
View All Result
  • Featured
  • News
  • Education
  • NEAR Protocol
  • Solana
  • Fantom
  • Yield Farming
  • Reviews
  • Press Releases
No Result
View All Result
The VR Soldier
No Result
View All Result

Shiba Inu (SHIB) Aims to Break Out of Descending Wedge Pattern

Jordan Avery by Jordan Avery
August 21, 2024
in News
Reading Time: 2 mins read
0
shiba -inu-shib-8891 1
Share on TwitterShare on Facebook

Shiba Inu (SHIB) price is attempting a bullish breakout from the descending wedge the coin has been in since March. Popular memecoin Shiba Inu (SHIB) has lost around 24% over the past month, but now it appears to be targeting a bullish breakout from its long-term pattern towards $0.000018.

The wedge narrows as Shiba Inu tries to start the rally

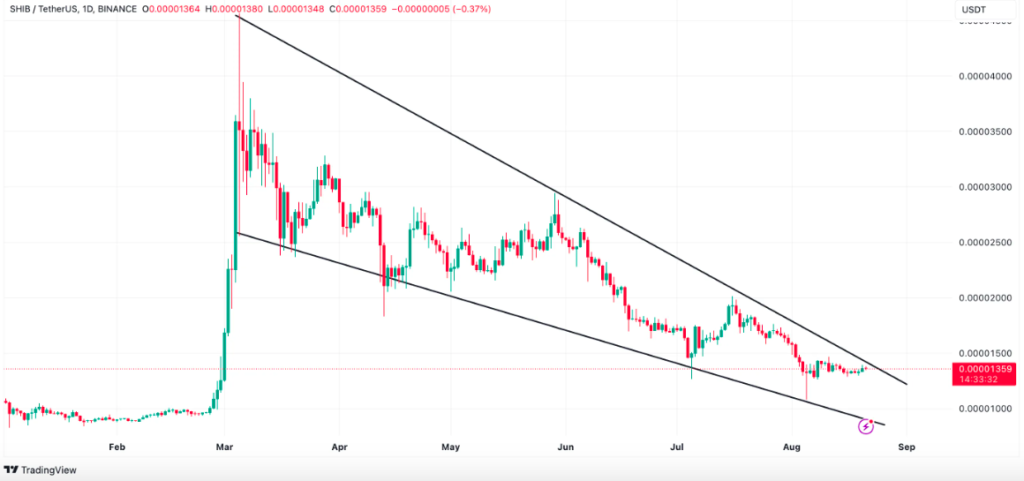
SHIB price reached a yearly high of $0.000035 on March 5 and has been steadily declining since then, forming a descending wedge. This technical pattern occurs when an asset forms a series of lower highs and lower lows that converge to form a wedge shape.

As the wedge narrows, buying pressure gradually increases. This is evident from the current price, which is approaching the point where the pattern lines converge. A bullish breakout from the wedge traditionally indicates a weakening of selling pressure and a possible shift from a downtrend to an uptrend.

Shiba Inu (SHIB) Aims to Break Out of Descending Wedge Pattern
SHIB Price Analysis. Source: TradingView

Similarly, the Chaikin Money Flow (CM F) indicator is also rising. This on-chain metric measures the movements of money flows into and out of an asset. Negative values ​​indicate that the initiative is on the sellers’ side, and liquidity is leaving the asset. Meanwhile, positive values ​​indicate that buyers are putting more pressure on the price. An influx of money into an asset is often associated with increased demand and a potential price increase.

Shiba Inu Analysis. Source: TradingView - breakout
Shiba Inu Analysis. Source: TradingView

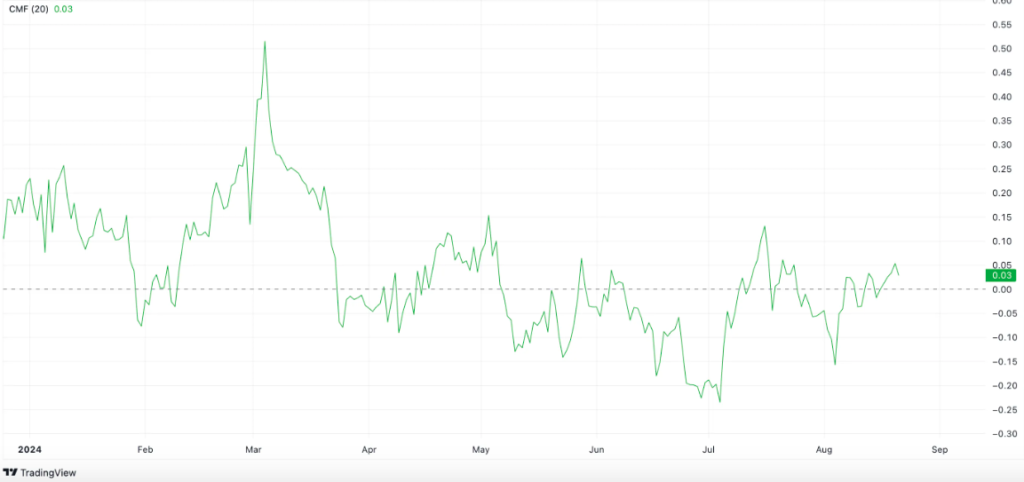
In the case of Shiba Inu, the indicator is above the center line, at 0.03, confirming the bullish momentum. This increases the probability of a price breakout from the falling wedge.

SHIB Outlook: Bulls Are Staying Active

The dots of the Parabolic Stop and Reverse ( SAR ) indicator are below the token price at the time of writing. This is a signal that the upward trend is continuing. This location of the dots relative to the price is considered bullish and can encourage traders to buy or hold the asset. Accordingly, growth may continue in the short term.

SHIB Price Analysis. Source: TradingView

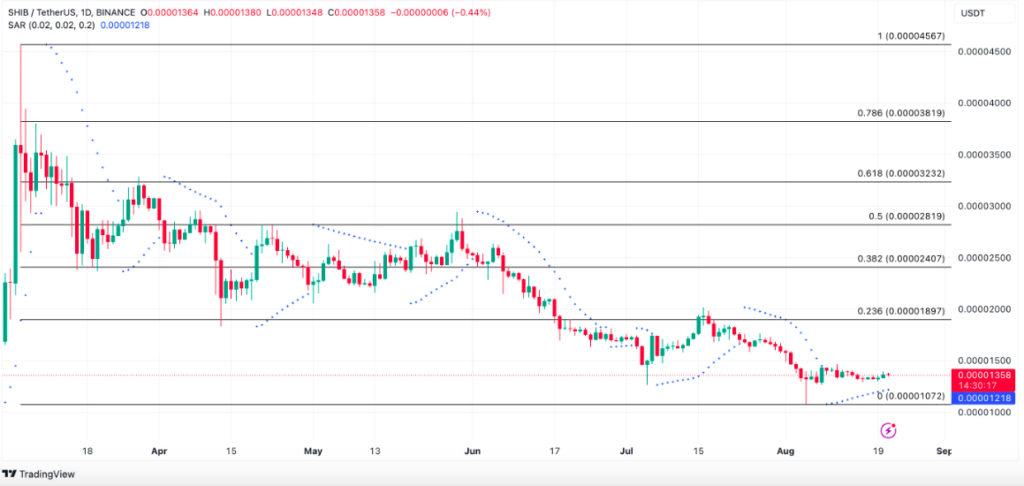
If the buying pressure continues, SHIB will make a successful bullish breakout from the descending wedge. After retesting the breakout line, the price will start to rise to $0.000018 and above. However, if selling intensifies, the SHIB price may drop to $0.000010.

Tags: bullish breakoutcryptocurrencyprice analysisShibShiba Inu
Previous Post

Justin Sun Launches Memecoins Platform on TRON

Next Post

Pepe Unchained Pre-Sale Simple Guide

Related Posts

XRP’s Coinbase Supply Crash Sparks Q4 Rally Speculation
Market Analysis

XRP Coinbase Supply Crash Sparks Q4 Rally Speculation

September 16, 2025
Featured

Pakistan Moves to Regulate Digital Asset

September 14, 2025
shibarium-shib-hardfork 1
Featured

Shibarium Bridge Hit by $2.4M Exploit

September 14, 2025
coinbase-ceo-bitcoin-Brian Armstrong 1
Featured

Coinbase Explains How Token Listings Work

September 14, 2025
XRP Targets a Breakout as Bulls Eye a 20% Surge
Market Analysis

XRP Targets a Breakout as Bulls Eye a 20% Surge

September 13, 2025
Featured

Bitcoin Takes a Breather After Record High – But the Bulls Aren’t Done Yet

September 13, 2025

Press Releases

XRP Aims for $4 as ETF Buzz Heats Up: Can the Hype Hold?
News

XRP Aims for $4 as ETF Buzz Heats Up: Can the Hype Hold?

by Alex Mercer
September 10, 2025

Ripple’s XRP is flirting with the $3 mark again, thanks to a tidal wave of speculation around a potential ETF...

Read more
Bitcoin 12.8% Dip Looks More Like Flexing Than Failing

Bitcoin 12.8% Dip Looks More Like Flexing Than Failing

September 2, 2025
Whales Stack Nearly $1B in XRP – Is $4 Now on the Horizon?

Whales Stack Nearly $1B in XRP – Is $4 Now on the Horizon?

September 1, 2025
Why Ethereum ATH Could Crush Bears Before Q3 Ends

Why Ethereum ATH Could Crush Bears Before Q3 Ends

August 12, 2025
Ethereum’s 28-Day Countdown: Will Ethereum Smash Through $3,030 Next?

Ethereum 28-Day Countdown: Will Ethereum Smash Through $3,030 Next?

July 20, 2025
The VR Soldier

© 2024 The VR Soldier

Navigate Site

  • About
  • Contact
  • Privacy Policy
  • Terms and Conditions

Follow Us

No Result
View All Result
  • Featured
  • News
  • Education
  • NEAR Protocol
  • Solana
  • Fantom
  • Yield Farming
  • Reviews
  • Press Releases

© 2024 The VR Soldier