Solana (SOL) price fell below an ascending support trend line that has held for almost 100 days, it also exited the short-term symmetrical triangle, falling below the Fibonacci support area.
Solana Failed to Hold Long-Term Support Level
Technical analysis of the daily timeframe shows that since October 16, 2023, SOL has been rising along an ascending support trendline, leading to a yearly high of $126 on December 25.
After this, the price of the asset began to fall. On January 19, 2024, it failed below the ascending support line and is currently trading inside the support area that coincides with the 0.382 Fibonacci retracement level. The daily Relative Strength Index (RSI) is bearish. The indicator is below 50 and continues to fall.
SOL Price Forecast: When will the Correction End?
Like the daily timeframe, the chart gives a bearish outlook. The most likely calculation suggests that SOL is in wave C of the ABC correction structure. Wave B took on the usual triangle shape for such structures.
The price action shows that the asset has exited the symmetrical triangle, confirming the correction. Additionally, the RSI is below 50 and falling. If the correction continues, Solana could drop another 20% before the support in the $70-$72 range merges.
However, a return to the triangle support trendline will mean that the correction is over. Then SOL could rise 30% to the next resistance at $115.
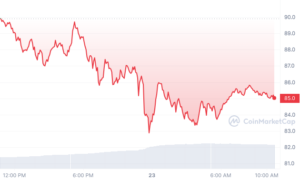
Technical analysis shows that the price of SOL has been rising along an ascending support line since October 2023. Since then, the price has fallen, forming several long upper wicks, before rebounding and consolidating above a rising support line that has been in place for 95 days.
The 6-hour time frame is not helpful in determining the direction of the SOL trend as the price action provides mixed signals. Although the asset managed to break through downward resistance and confirm it as support, the presence of a short-term symmetrical triangle on the chart hints at a breakout.
Wave analysis confirms the possibility of such a scenario developing. The most likely calculation suggests that the triangle is part of wave B in an ABC correction structure. A wave A:C ratio of 1:0.618 will result in a low around $78. A similar goal is achieved by projecting the length of the triangle onto the breakdown level.
About Solana
Solana is an open-source blockchain platform focused on scalability, speed and security while keeping transaction costs low. Blockchain architecture facilitates the creation of smart contracts and decentralized applications. The network throughput can reach 710,000 transactions per second (TPS), according to the project white paper.
Due to its accessibility, Solana is popular among users in the DeFi sector. In December 2023, analysts estimated that the number of active addresses on the network exceeded 15.6 million.
The total value of funds locked in smart contracts (TVL) of the project exceeded $1.29 billion as of January 23, 2024, according to DeFiLlama. Thus, at the time of writing, Solana is among the top 5 blockchains by indicator.
Solana stands out for its speed of transaction processing and low fees. There are various DeFi and NFT projects in the network ecosystem, and users can also contribute their assets to staking and maintain the security and proper level of decentralization of the project.

