• About
  • Contact
  • Privacy Policy
  • Terms and Conditions
Tuesday, October 7, 2025
The VR Soldier
  • Featured
  • News
  • Education
  • NEAR Protocol
  • Solana
  • Fantom
  • Yield Farming
  • Reviews
  • Press Releases
No Result
View All Result
  • Featured
  • News
  • Education
  • NEAR Protocol
  • Solana
  • Fantom
  • Yield Farming
  • Reviews
  • Press Releases
No Result
View All Result
The VR Soldier
No Result
View All Result

Top 4 Bitcoin Chart Elements To Watch In Reading The Markets

Will Izuchukwu by Will Izuchukwu
July 27, 2023
in Featured
Reading Time: 2 mins read
0
Share on TwitterShare on Facebook

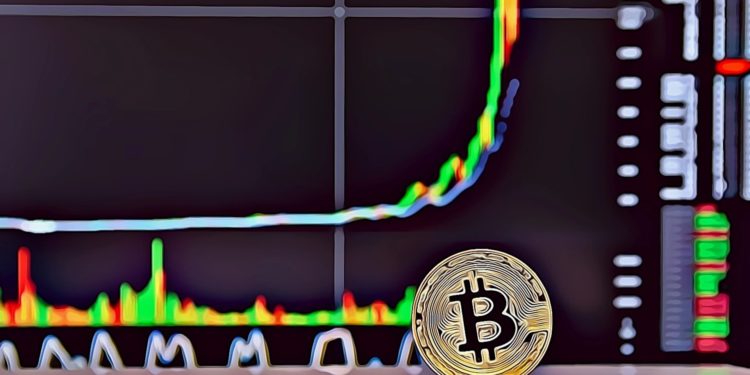
When reading market analysis for Bitcoin or any other cryptocurrencies, there are four key chart elements that traders and investors should closely observe to make informed decisions:

  1. Price Trends and Patterns: Keep a keen eye on the overall price trend of Bitcoin over different timeframes, such as daily, weekly, and monthly. Identify significant price patterns like uptrends, downtrends, and consolidations. Chart patterns like head and shoulders, double tops/bottoms, and triangles can offer insights into potential trend reversals or continuation.
  1. Support and Resistance Levels: Identify key support and resistance levels on the Bitcoin chart. These levels represent areas where the price has historically shown strong buying or selling pressure. Breakouts above resistance or breakdowns below support can signal significant price movements.
  1. Trading Volume: Analyze the trading volume alongside price movements. High trading volume during price changes indicates strong market participation and confirms the validity of price trends. Conversely, low volume during price swings may suggest weak momentum and potentially unreliable trends.
  1. Indicators and Oscillators: Implement technical indicators and oscillators to gain additional insights. Common indicators like Moving Averages, Relative Strength Index (RSI), and Moving Average Convergence Divergence (MACD) can help identify overbought or oversold conditions and potential trend reversals.

By carefully studying these four elements, traders can develop a more comprehensive understanding of the Bitcoin market’s current state and anticipate potential future price movements. However, it’s essential to combine technical analysis with fundamental analysis and risk management strategies to make well-informed decisions in the volatile cryptocurrency market.

Disclosure: This is not trading or investment advice. Always do your research before buying any cryptocurrency or investing in any service.

Follow us on Twitter @thevrsoldier to stay updated with the latest Crypto, NFT, and Metaverse news!

Image Source: chubakas123/123RF// Image Effects by Colorcinch

Tags: bitcoinChartCryptoTrading
Previous Post

PEPE Makes Milestone Return To A Record Number Of Social Engagements

Next Post

Price Prediction: The Sandbox, Decentraland, and Pomerdoge, Which Crypto Will 40x?

Related Posts

Featured

MetaMask Rewards Program Targets Active Users

October 5, 2025
Featured

Ethereum Foundation to Sell 1,000 ETH

October 5, 2025
Featured

OctaFX Probe Exposes Global Fraud Network

October 5, 2025
Altcoin Season Index Soars to 76 While Bitcoin Dominance Wobbles
Featured

Altcoin Season Stalls as Uptober Hopes Build

October 3, 2025
bitcoin btc
Featured

Strategy Bitcoin Holdings Hit Record $77.4B

October 3, 2025
Featured

Hacker Converts Loot into Solana

October 3, 2025

Press Releases

NFT Market Sees $129M Weekly Sales as BNB Chain Surges
News

NFT Market Sees $129M Weekly Sales as BNB Chain Surges

by Jordan Avery
September 28, 2025

The NFT sector continues to show resilience with sales volumes climbing 8.13% to reach $129.1 million, marking the third straight...

Read more
Ethereum Can Outshine Google Says Vitalik Buterin – Here’s How

Ethereum Can Outshine Google Says Vitalik Buterin – Here’s How

September 21, 2025
XRP Aims for $4 as ETF Buzz Heats Up: Can the Hype Hold?

XRP Aims for $4 as ETF Buzz Heats Up: Can the Hype Hold?

September 10, 2025
Bitcoin 12.8% Dip Looks More Like Flexing Than Failing

Bitcoin 12.8% Dip Looks More Like Flexing Than Failing

September 2, 2025
Whales Stack Nearly $1B in XRP – Is $4 Now on the Horizon?

Whales Stack Nearly $1B in XRP – Is $4 Now on the Horizon?

September 1, 2025
The VR Soldier

© 2024 The VR Soldier

Navigate Site

  • About
  • Contact
  • Privacy Policy
  • Terms and Conditions

Follow Us

No Result
View All Result
  • Featured
  • News
  • Education
  • NEAR Protocol
  • Solana
  • Fantom
  • Yield Farming
  • Reviews
  • Press Releases

© 2024 The VR Soldier