
The price of the leading artificial intelligence-based token, Render (RENDER), has plummeted 25% over the past week. While a key on-chain metric suggests this may be a good time to buy the altcoin, its price remains at risk of falling further.
Render Buyers Should Take Caution
As of this writing, RENDER trades at $4.62. During Monday’s market downturn, the altcoin plummeted to a seven-month low of $4.14.
According to RENDER’s market value to realized value (MVRV) ratio, now may be a good time to buy the altcoin as it is currently undervalued. The negative values of this ratio, when assessed over different moving averages, confirm this. Per Santiment, RENDER’s 30-day and 90-day MVRV ratios are -9.47 and -25.79, respectively.

This metric measures the ratio between an asset’s current price and the average price at which all its coins or tokens were acquired. When its value is positive, the asset’s market value is higher than the cost basis for most investors. Here, the token is overvalued, and coin holders can sell for profit.
Conversely, an MVRV ratio below zero indicates that the asset’s market value is less than the average purchase price of all its circulating tokens, signaling that it is undervalued.
A negative MVRV ratio presents a good buying opportunity, as it connotes that the asset trades at a lower price. This allows traders to accumulate it, hoping to sell it at a higher price later.
Price Below 20-Day EMA and 50-Day SMA, Downtrend to Continue?
However, RENDER’s price action on a daily chart hints at the continuation of its downtrend in the short term. At its current price, RENDER trades below its 20-day exponential moving average (EMA (blue line) and its 50-day small moving average (SMA) (yellow line).
An asset’s 20-day EMA is a short-term moving average that reacts quickly to price changes. It reflects the average closing price of an asset over the past 20 days. Meanwhile, the 50-day SMA, on the other hand, is a longer-term moving average that reflects an asset’s average closing price over the past 50 days.
When an asset trades below these moving averages, it indicates its price has declined over both short—and medium-term periods. This bearish trend is seen by traders as a signal to sell or avoid buying until the asset shows signs of recovery above these moving averages.

Additionally, RENDER’s Relative Strength Index (RSI) is in a downtrend at 31.36 at press time. This indicator measures an asset’s oversold and overbought market conditions. At 31.36, RENDER’s RSI confirms a decline in buying activity.
RENDER Price Prediction: Token May Revisit 7-Month Low
The further the demand for RENDER dries up, the more it is at risk of devaluation. Once it sheds its gains of the past 24 hours, the altcoin will revisit its seven-month low of $4.14 and may even fall below it to trade at $3.41.
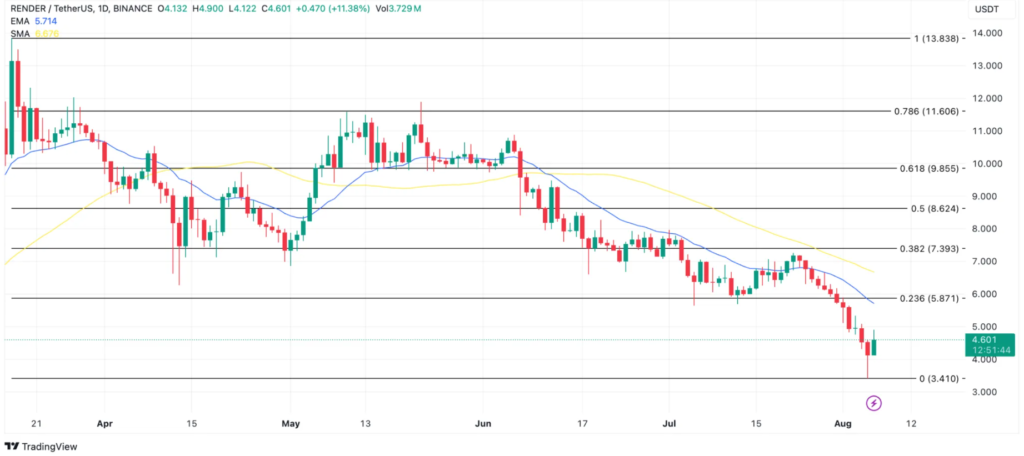
However, if more traders begin to “buy the dip” and RENDER accumulation steadies, its price may climb to $5.87.